Educational Takeaway: Net 500 Points Captured in NIFTY_I with VC + CR + TBTS using Bell Orderflow Ultimate
The latest move in NIFTY_I showcased how structured orderflow analysis combined with disciplined level-based execution can help traders identify strong directional opportunities with clarity. Using VC, CR, and TBTS from Bell Orderflow Ultimate, the market delivered a well-structured two-phase move with clean reactions around equilibrium zones and controlled risk parameters.
Maximize Your Trading Edge with Bell Orderflow Ultimate Visit www.belltpo.com or reach out to us for more details.
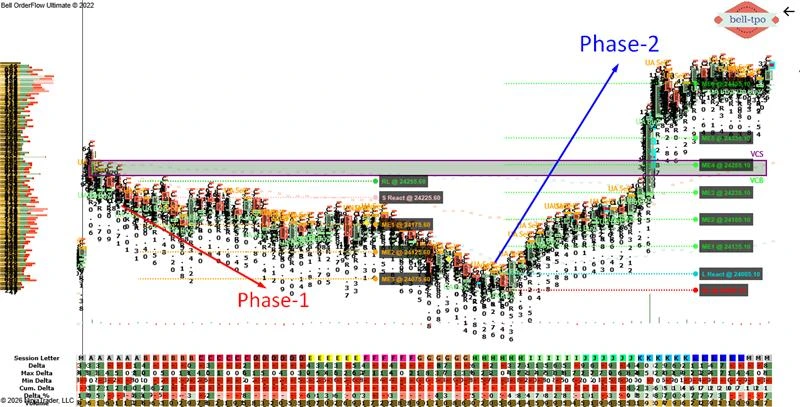
Phase 1: 150 Points Directional Expansion (VC + CR)
Key Levels
- RL (Risk Limit @ 24255.60)
- S React (Price Reaction @ 24225.60)
- ME-1 (Market Equilibrium @ 24175.60)
- ME-2 (Market Equilibrium @ 24125.60)
- ME-3 (Market Equilibrium @ 24075.60)
Market Behaviour Analysis
- The first phase started with a strong VC + CR combination, indicating aggressive participation and directional intent from market participants. Price respected the reaction zone cleanly and continued to rotate through multiple equilibrium levels without major disruption.
- The sequential acceptance below each Market Equilibrium zone confirmed sustained momentum and continuation strength. Each ME level acted as a structured roadmap for tracking market balance and imbalance during the move.
Understanding the ME Levels
- The ME zones helped traders identify how price was accepting value lower with continuation pressure. Smooth movement from one equilibrium zone to another generally reflects strong directional conviction in the market.
- As price continued to migrate through ME-1, ME-2, and ME-3, it indicated controlled auction activity rather than random volatility. These levels provided a framework for monitoring momentum quality and market efficiency.
Understanding the Price Reaction Level
- The Price Reaction zone acted as the initial reference area where aggressive participation entered the market. Strong acceptance away from this level highlighted the presence of initiative activity and directional confidence.
- The reaction level also helped traders understand whether the market intended to continue expansion or revert back into balance. Sustained movement away from the reaction zone confirmed continuation strength during this phase.
Understanding the Risk Limit
- The Risk Limit level provided a predefined invalidation structure for the setup. Having a clearly defined risk boundary helps traders maintain discipline during high-volatility conditions.
- A stable move away from the Risk Limit area indicated that the market maintained directional acceptance throughout the phase. This helped avoid emotional decision-making and supported structured trade management.
Phase 2: 350 Points Expansion Move (TBTS + CR)
Key Levels
- L React (Price Reaction @ 24085.10)
- RL (Risk Limit @ 24055.10)
- ME-1 (Market Equilibrium @ 24135.10)
- ME-2 (Market Equilibrium @ 24185.10)
- ME-3 (Market Equilibrium @ 24235.10)
- ME-4 (Market Equilibrium @ 24285.10)
- ME-5 (Market Equilibrium @ 24335.10)
- ME-6 (Market Equilibrium @ 24435.10)
Market Behaviour Analysis
- The second phase was driven by a strong TBTS + CR combination, leading to a broad directional expansion across multiple equilibrium zones. Price continued to migrate efficiently through higher value areas while maintaining strong momentum characteristics.
- This phase demonstrated how continuation concepts aligned with equilibrium migration can produce sustained expansion moves. The orderly progression across six ME levels reflected strong participation and clean auction development.
Understanding the ME Levels
- The ME zones acted as dynamic balance references throughout the move and helped track value migration step by step. Consistent acceptance above each equilibrium area indicated strong continuation behaviour and healthy auction structure.
- As the market advanced through ME-1 to ME-6, the equilibrium shifts highlighted continuous value development rather than temporary spikes. This type of structured movement often reflects sustained institutional participation.
Understanding the Price Reaction Level
- The Price Reaction zone acted as the foundation for the expansion move and established the initial directional intent. Strong movement away from this area showed clear initiative participation entering the market.
- Reaction zones are critical because they help traders differentiate between temporary volatility and genuine expansion activity. In this case, continued acceptance beyond the reaction area confirmed momentum continuation.
Understanding the Risk Limit
- The Risk Limit once again served as the protective boundary for the setup structure. Clearly defining this level helps traders maintain consistency and avoid overexposure during volatile market conditions.
- The market holding well beyond the Risk Limit area reinforced the strength of the directional move. Structured risk planning remains one of the most important components of professional orderflow trading.
Conclusion
This entire NIFTY_I move demonstrated how the combination of VC + TBTS + CR concepts in Bell Orderflow Ultimate can help traders understand market intent, continuation strength, and equilibrium migration with greater clarity. The structured transition through multiple ME levels along with clean reaction behaviour highlighted how institutional participation drives directional expansion in the market. VC zones helped identify the initial momentum participation areas, while TBTS confirmed continuation strength during the expansion phase. CR added additional confirmation to the ongoing directional activity, allowing traders to track market structure systematically using equilibrium levels, reaction zones, and predefined risk boundaries within Bell Orderflow Ultimate.Maximize Your Trading Edge with Bell Orderflow Ultimate Visit www.belltpo.com or reach out to us for more details.