Educational Takeaway: Net 170 Points Move Captured in NIFTY_I with VC + TBTS + CR + UA using Bell Orderflow Ultimate
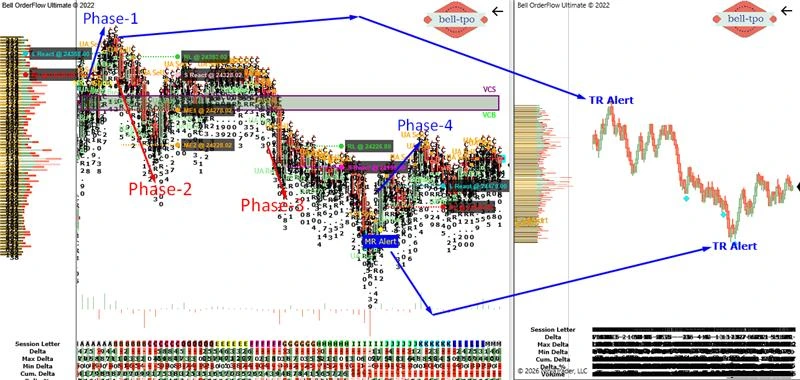
This session offered a structured multi-phase opportunity, where order flow alignment and equilibrium tracking helped decode both continuation and reversal behavior. The move unfolded in three distinct phases, each highlighting the importance of Price Reaction (PR), Risk Limit (RL), and Market Equilibrium (ME) dynamics.
Maximize Your Trading Edge with Bell Orderflow Ultimate Visit www.belltpo.com or reach out to us for more details.
Phase 1: Initial Rejection & Controlled Risk (30 Points RL Hit)
S React (Short Price Reaction @ 24040.00)
- Price reacted at a higher level, indicating responsive presence and initial resistance.
- The reaction suggested a lack of acceptance above, reflecting potential downside pressure.
RL (Risk Limit @ 24070.00)
- The defined risk limit provided a clear invalidation point for the short-side expectation.
- Once breached, it confirmed that the initial structure was not holding, leading to a controlled exit.
ME Context (Implicit Absence)
- No strong equilibrium formed in this phase, highlighting imbalance-driven movement.
- This lack of ME stability often results in quick tests of risk limits.
Phase 2: Structured Short Continuation with VC + CR (50 Points Move)
S React (Short Price Reaction @ 24011.80)
- A fresh short reaction confirmed continuation after rejection from higher levels.
- This reinforced responsive dominance and validated the downward structure.
RL (Risk Limit @ 24041.80)
- The risk limit acted as a protective boundary for the continuation phase.
- Holding below this level maintained directional control and prevented reversal.
ME-1 (Market Equilibrium @ 23961.80)
- The first equilibrium level acted as a magnet, drawing price efficiently.
- It also served as a logical pause zone where partial balancing occurred before continuation.
Phase 3: Strong Reversal & Expansion with TBTS + CR (150 Points Move)
L React (Long Price Reaction @ 23975.00)
- A decisive long reaction marked the shift from downside to upside control.
- This reaction indicated absorption of opposing pressure and entry of aggressive participants.
RL (Risk Limit @ 23945.00)
- The risk limit defined the lower boundary of the upward structure.
- Holding above this level confirmed strength and supported the sustained upward move.
ME-1 (Market Equilibrium @ 24025.00)
- This level acted as the first confirmation of balance after reversal.
- Price acceptance above it strengthened upward conviction.
ME-2 (Market Equilibrium @ 24075.00)
- The second equilibrium provided continuation validation within the trend.
- Each acceptance reinforced that control remained intact.
ME-3 (Market Equilibrium @ 24125.00)
- The third equilibrium acted as an extension target within the expansion phase.
- It highlighted structured movement rather than random price behavior.
Key Learning Summary
- Price Reactions identify where control shifts within the market.
- Risk Limits define the boundaries of structure and protect against invalidation.
- Market Equilibrium levels act as magnets, checkpoints, and continuation references within a move.
Maximize Your Trading Edge with Bell Orderflow Ultimate Visit www.belltpo.com or reach out to us for more details.