Educational Takeaway: Net 10 Points Move Captured in NIFTY_I with VC + TR + CR + TBTS using Bell Orderflow Ultimate
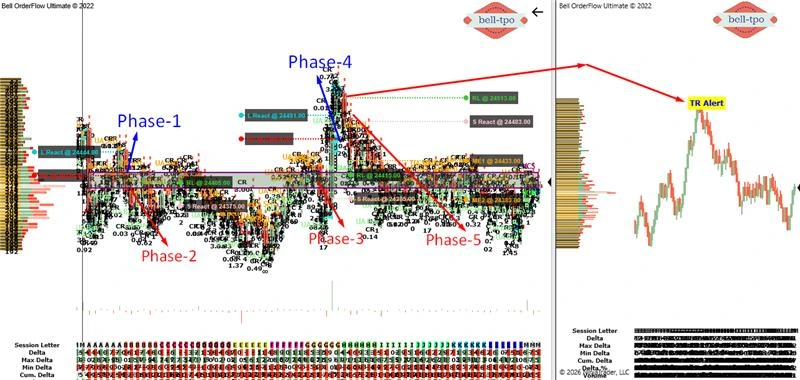
The session showcased how Bell Orderflow Ultimate helps traders understand changing market conditions through VC, TR, CR, and TBTS concepts. The market initially displayed rotational behaviour with multiple Risk Limit reactions before a strong directional move emerged during Phase 5.
The study below explains how Price Reaction zones, Risk Limits, and Market Equilibrium levels helped structure the session without emotional decision-making.
Maximize Your Trading Edge with Bell Orderflow Ultimate Visit www.belltpo.com or reach out to us for more details.
Phase 1 – 30 Points Risk Limit Hit
L React (Long Price Reaction @ 24444.00)
- The Long Price Reaction zone indicated responsive activity entering the market.
- Price attempted to stabilize around this area, creating the first indication of upward participation.
RL (Risk Limit @ 24414.00)
- The Risk Limit acted as the protective boundary for the ongoing structure.
- Once price moved into this region, volatility expanded rapidly and the complete 30-point Risk Limit objective was achieved.
- The RL zone also highlighted increasing pressure against the ongoing structure.
- This demonstrated how Bell Orderflow Ultimate helps identify exhaustion and expansion areas effectively.
Phase 2 – 30 Points Risk Limit Hit
RL (Risk Limit @ 24405.00)
- The market again approached a key Risk Limit area after failing to sustain higher prices.
- This level acted as an important reference for measuring downside pressure and volatility expansion.
- The 30-point Risk Limit was completed efficiently as responsive activity increased.
- Repeated acceptance near RL confirmed continuation of weak market structure.
S React (Short Price Reaction @ 24375.00)
- The Short Price Reaction zone highlighted aggressive responsive participation.
- Price responded sharply from this region, confirming increasing weakness inside the session structure.
Phase 3 – 30 Points Risk Limit Hit
RL (Risk Limit @ 24415.00)
- The Risk Limit once again became the controlling reference for the ongoing move.
- Repeated interaction around this level showed that responsive participants continued defending higher prices.
- The market successfully completed another 30-point Risk Limit expansion during this phase.
- This reflected continuation of directional pressure and efficient downside rotation.
S React (Short Price Reaction @ 24385.00)
- The Short Price Reaction zone continued to attract downside activity.
- This confirmed that the market was accepting lower prices instead of reversing immediately.
Phase 4 – (Exit at Cost due to TR Trend Change)
L React (Long Price Reaction @ 24491.00)
- The Long Price Reaction attempted to create recovery momentum after earlier weakness.
- Responsive participants initially engaged near this region, but follow-through strength remained limited.
RL (Risk Limit @ 24461.00)
- The Risk Limit provided the final structural boundary before the market environment changed.
- The move eventually exited near cost as the developing TR structure in the next phase indicated weakening upside continuation.
- This phase highlighted the importance of protecting gains during changing market conditions.
- Bell Orderflow Ultimate helped identify the transition before major directional expansion developed.
Phase 5 – 100 Points Short Move (TBTS + TR + CR)
RL (Risk Limit @ 24513.00)
- The Risk Limit marked the upper boundary from where strong rejection emerged.
- This level became the starting point for the major downside expansion seen during the session.
S React (Short Price Reaction @ 24483.00)
- The Short Price Reaction confirmed aggressive responsive dominance entering the market.
- Price acceptance below this region added confidence to the developing directional structure.
ME-1 (Market Equilibrium @ 24433.00)
- ME-1 acted as the first equilibrium balance zone during the downside move.
- Once price accepted below this area, momentum continued efficiently toward lower references.
ME-2 (Market Equilibrium @ 24383.00)
- ME-2 became the secondary balance region where the market attempted temporary stabilization.
- Sustained activity below this equilibrium reflected continued directional acceptance and strong control.
Conclusion
This session highlighted how Bell Orderflow Ultimate helps identify structural transitions through Risk Limits, Price Reactions, and Market Equilibrium zones. The early phases displayed rotational movement, while Phase 5 clearly demonstrated directional conviction through the combined effect of VC + TBTS + TR + CR. Understanding how price behaves around RL, React zones, and ME levels allows traders to interpret market acceptance, rejection, and momentum shifts with better clarity and structure.Maximize Your Trading Edge with Bell Orderflow Ultimate Visit www.belltpo.com or reach out to us for more details.