Educational Takeaway: Net 10 Points Move Captured in NIFTY_I with VC + MR + TR + CR using Bell Orderflow Ultimate
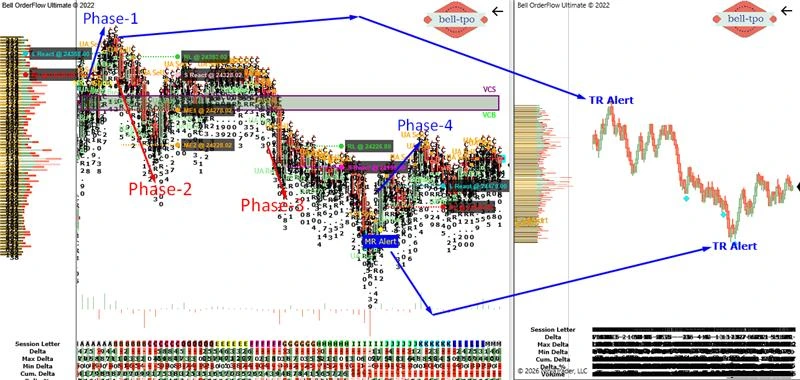
This session clearly demonstrates how different orderflow concepts align across phases, highlighting risk engagement, equilibrium development, and structured moves. Notably, Phase 2 captured a strong 100-point move using TR + CR + TBTS, while the other phases reflected risk limit engagements of ~30 points each.
Maximize Your Trading Edge with Bell Orderflow Ultimate Visit www.belltpo.com or reach out to us for more details.
Phase 1: Risk Limit Engagement (30 Points Move)
L React (Long Price Reaction @ 24358.00)
- Price showed a clear reaction at this level, indicating responsive participation.
- Such reactions often indicate temporary control shifts and short-term structure formation.
RL (Risk Limit @ 24328.00)
- The risk limit was tested and a ~30-point move unfolded within this boundary.
- It defined the structural tolerance where price rotated before transition.
ME Levels
- No equilibrium levels were established in this phase.
- This indicates the market remained in an imbalanced state without forming value.
Phase 2: Strong Structured Move (100 Points | TR + CR + TBTS)
S React (Short Price Reaction @ 24328.02)
- A strong reaction confirmed active participation at this level.
- This reinforced continuation behavior aligned with structural weakness.
RL (Risk Limit @ 24353.02)
- This level acted as a firm cap, restricting upward movement.
- It defined the invalidation boundary for the ongoing structure.
ME-1 (Market Equilibrium @ 24278.02)
- The first equilibrium zone showed initial acceptance and temporary balance.
- Such levels act as reference zones during structured movement.
ME-2 (Market Equilibrium @ 24228.02)
- A second equilibrium formed deeper, confirming broader value acceptance.
- Multiple ME levels reflect sustained directional efficiency and control.
Phase 3: Risk Limit Engagement (30 Points Move)
S React (Short Price Reaction @ 24196.80)
- Price reacted again, maintaining consistency in participation behavior.
- Repeated reactions indicate continuation of the established structure.
RL (Risk Limit @ 24226.80)
- The risk limit was hit, resulting in another ~30-point move.
- It continued to act as a defining boundary for price action.
ME Levels
- No new equilibrium levels were formed in this phase.
- This reflects continuation without balance formation.
Phase 4: Final Risk Limit Engagement (30 Points Move)
L React (Long Price Reaction @ 24170.00)
- A reaction at this level suggested slowing momentum near lower levels.
- Such responses often emerge around exhaustion or temporary stabilization.
RL (Risk Limit @ 24140.00)
- The risk limit was again engaged, producing a ~30-point move.
- It marked the lower boundary of price exploration in this phase.
ME Levels
- No equilibrium zones were established here.
- This indicates a terminal phase with minimal balance development.
Key Insights
- Phase 2 stood out, capturing a 100-point structured move driven by TR + CR + TBTS alignment.
- Phases 1, 3, and 4 consistently showed ~30-point moves driven by Risk Limit interactions.
- Price Reactions confirmed participation at key levels across all phases.
- Risk Limits acted as structural boundaries defining movement potential.
- Market Equilibrium levels only appeared during strong structured movement, reinforcing their importance in trend phases.
Maximize Your Trading Edge with Bell Orderflow Ultimate Visit www.belltpo.com or reach out to us for more details.