Educational Takeaway: Net 40 Points Move Captured in NIFTY_I with VC + TBTS + CR using Bell Orderflow Ultimate

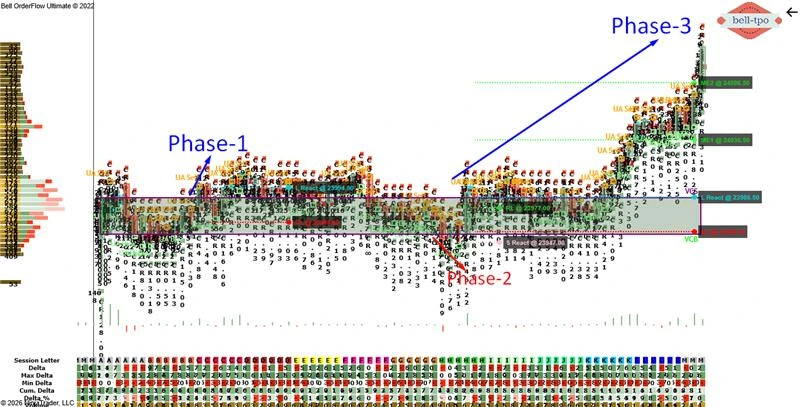
This NIFTY_I session showcased how Bell Orderflow Ultimate helped identify structured market behavior through reaction zones, equilibrium levels, and defined risk boundaries. Rather than random price movement, the session reflected controlled market participation where key levels repeatedly influenced price action.
The combination of VC, TBTS, and CR provided a framework to observe market transitions and understand how price reacted around important areas during different phases.
Maximize Your Trading Edge with Bell Orderflow Ultimate Visit www.belltpo.com or reach out to us for more details.
Phase 1: 30 Points Risk Limit Hit
Key Levels
- L React (Long Price Reaction @ 23994.80)
- RL (Risk Limit @ 23964.80)
Understanding the Price Reaction Level
- The Long Price Reaction zone represented an area where price initially received strong support and participation increased. This level highlighted the market’s attempt to establish directional confidence.
- Price Reaction levels help identify areas where immediate responses from participants become visible. Strong reactions from these zones often indicate active market involvement.
Understanding the Risk Limit Level
- The Risk Limit level acted as a structural boundary defining where the setup strength could weaken. Interaction with this level suggested increasing uncertainty within the ongoing structure.
- Risk Limit zones help traders maintain discipline by clearly identifying areas where market conditions are changing. These levels reduce emotional decision-making during fast-moving sessions.
Phase 2: 30 Points Risk Limit Hit
Key Levels
- RL (Risk Limit @ 23977.00)
- S React (Short Price Reaction @ 23947.00)
Understanding the Price Reaction Level
- The Short Price Reaction level highlighted an area where resistance participation became visible and momentum started shifting. Price showed immediate response after entering this zone.
- Reaction levels often help identify where market participants begin defending important areas. These zones can frequently influence short-term market structure.
Understanding the Risk Limit Level
- The Risk Limit zone again served as the invalidation boundary for the ongoing structure. Interaction with this level indicated weakening directional confidence.
- Risk Limit levels are useful because they create an objective approach to understanding whether the existing market structure remains healthy or begins losing strength.
Phase 3: 100 Points Long Move (VC + CR + TBTS)
Key Levels
- ME-2 (Market Equilibrium @ 24086.50)
- ME-1 (Market Equilibrium @ 24036.50)
- L React (Long Price Reaction @ 23986.50)
- RL (Risk Limit @ 23956.50)
Understanding the ME Levels
- ME-1 and ME-2 acted as balance zones where price found acceptance before continuing its expansion. These levels helped map the migration of value during the session.
- Market Equilibrium levels are important because they indicate where opposing participants temporarily reach balance. Sustained acceptance around these areas often supports structured directional movement.
Understanding the Price Reaction Level
- The Long Price Reaction level identified the area where strong participation emerged before the major expansion phase developed. The reaction created a stable foundation for continuation.
- Price Reaction levels help traders identify where momentum can initiate after active market response. Strong reactions around these levels frequently support extended movement.
Understanding the Risk Limit Level
- The Risk Limit level acted as a protective structural boundary throughout the setup. Price remaining above this level maintained confidence in the ongoing market structure.
- Risk Limit zones create clarity by defining where the market structure changes significantly. They help traders maintain consistency and avoid unnecessary exposure.
Conclusion
This session demonstrated how Bell Orderflow Ultimate can help interpret market behavior using reaction zones, equilibrium levels, and risk-defined structures. The interaction between VC, TBTS, and CR created a clear framework for understanding how price moved through different phases. Studying Market Equilibrium, Price Reaction, and Risk Limit levels together helps improve market clarity and strengthens confidence in interpreting intraday orderflow dynamics.Maximize Your Trading Edge with Bell Orderflow Ultimate Visit www.belltpo.com or reach out to us for more details.