Educational Takeaway: Net 190 Points Move Captured in NIFTY_I with VC + TBTS + CR using Bell Orderflow Ultimate

The session demonstrated how structured market participation combined with VC, TBTS, and CR concepts can help traders understand value migration and equilibrium shifts during directional market phases. Rather than focusing only on price movement, the framework provided clear references showing how the market transitioned from reaction phases into sustained momentum.
This move highlighted how multiple phases can unfold within the same session, where initial reactions, risk zones, and equilibrium migrations together created a structured roadmap for market behavior.
Maximize Your Trading Edge with Bell Orderflow Ultimate Visit www.belltpo.com or reach out to us for more details.
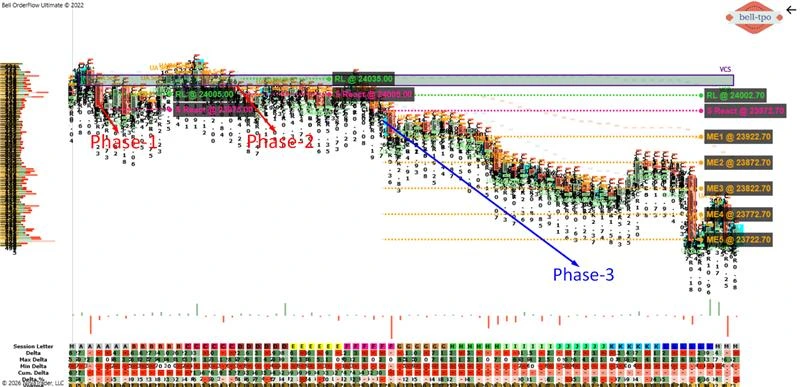
Phase 1 – 30 Points Risk Limit Hit
RL (Risk Limit @ 24005.00)
- The Risk Limit zone acted as an important boundary where volatility started expanding and market participation increased.
- This level helped identify the control area where price behavior became more sensitive to directional movement.
- Risk Limit zones provide traders with important references to understand whether price is accepting or rejecting value.
- Observing market behavior around these levels helps identify changes in participation.
S React (Short Price Reaction @ 23975.00)
- The Price Reaction zone highlighted the first active response from market participants.
- Price showed immediate reaction around this area before completing the initial movement phase.
- Price Reaction zones are useful because they identify where active participation begins entering the market.
- These reactions often become reference points for future market behavior.
Phase 2 – 30 Points Risk Limit Hit
RL (Risk Limit @ 24035.00)
- The second Risk Limit zone created another important control area for observing market participation.
- Price interaction around this region helped define whether continuation or rejection would dominate.
- Risk Limit references become increasingly important when markets revisit higher participation zones.
- These areas often help traders understand shifts in control.
S React (Short Price Reaction @ 24005.00)
- The Price Reaction zone once again showed strong response behavior from market participants.
- The market respected this area and completed another structured reaction phase.
- Reaction zones provide insight into where momentum and participation become more active.
- Understanding these zones helps create a more structured view of market movement.
Phase 3 – 250 Points Move Using VC + CR
RL (Risk Limit @ 24002.70)
- The Risk Limit zone marked the beginning of a larger directional phase where value started migrating lower.
- Price interaction around this level provided early clues about increasing participation strength.
- Risk Limit zones help identify transition areas between balanced and directional conditions.
- Monitoring these levels allows traders to understand evolving market structure.
S React (Short Price Reaction @ 23972.70)
- The Price Reaction zone became the first important participation area within the larger move.
- This reaction established the foundation for continued equilibrium migration.
- Reaction zones help identify where active market response is occurring.
- These areas often become valuable reference points throughout the session.
ME-1 (Market Equilibrium @ 23922.70)
- ME-1 represented the first equilibrium transition during the move.
- Price acceptance around this area confirmed continuation of structured market behavior.
- Market Equilibrium levels help identify balance points between participants.
- These zones are useful for tracking value migration.
ME-2 (Market Equilibrium @ 23872.70)
- ME-2 acted as another important balancing area during the continuation phase.
- Price continued respecting equilibrium transitions without creating major structural changes.
- Equilibrium levels reveal how value shifts during directional conditions.
- Tracking these transitions helps traders understand participation strength.
ME-3 (Market Equilibrium @ 23822.70)
- ME-3 highlighted continued lower value acceptance during the session.
- The market maintained orderly structure while interacting around equilibrium.
- Equilibrium zones help reduce emotional decision-making during volatile conditions.
- They provide objective references for observing market behavior.
ME-4 (Market Equilibrium @ 23772.70)
- ME-4 served as another important distribution area during the move.
- Price briefly stabilized here before continuing its directional structure.
- These equilibrium references help identify whether momentum remains healthy.
- Observing balance zones improves understanding of market continuation.
ME-5 (Market Equilibrium @ 23722.70)
- ME-5 represented the final major equilibrium reference during this move.
- The market continued respecting lower balance areas while maintaining structure.
- Final equilibrium zones often provide insight into exhaustion or continuation behavior.
- Understanding these areas helps traders prepare for future sessions.
Conclusion
This session demonstrated how VC, TBTS, and CR concepts combined with equilibrium analysis can provide a structured framework for understanding market movement. Instead of focusing purely on price fluctuations, traders could observe reaction zones, risk boundaries, and equilibrium migration to interpret market behavior more effectively. Bell Orderflow Ultimate helps visualize these market dynamics in real time, allowing traders to better understand participation, balance, and value migration during fast-moving sessions.Maximize Your Trading Edge with Bell Orderflow Ultimate Visit www.belltpo.com or reach out to us for more details.