Educational Takeaway: Yesterday Net 350 Points Move Captured in NIFTY_I with VC + TBTS + CR using Bell Orderflow Ultimate
Market structure and order flow often reveal important clues about directional intent, reactions, and risk zones. This session demonstrated how combining VC, TBTS, and CR helped identify both downside continuation and upside expansion opportunities while maintaining a structured framework.
Maximize Your Trading Edge with Bell Orderflow Ultimate Visit www.belltpo.com or reach out to us for more details.
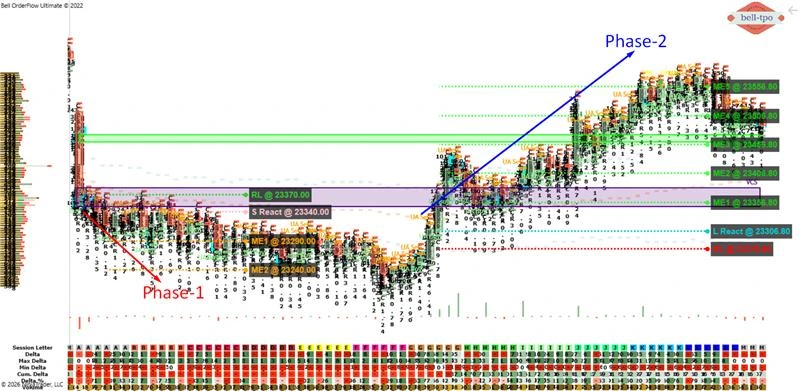
Phase 1: 100 Points Short Move (TBTS + VC + CR)
Key Levels Observed
- RL (Risk Limit @ 23370.00)
- S React (Short Price Reaction @ 23340.00)
- ME-1 (Market Equilibrium @ 23290.00)
- ME-2 (Market Equilibrium @ 23240.00)
Understanding the Structure
Market Equilibrium (ME) Levels
- ME levels act as structured reference zones where price frequently interacts, pauses, or transitions between balance and imbalance.
- Multiple equilibrium levels forming sequentially often provide valuable insight into the strength and continuation of the ongoing move.
Price Reaction Zones
- Price reaction areas help identify locations where aggressive participation enters the market.
- These zones frequently become important reference points for understanding whether momentum is being sustained or absorbed.
Risk Limit (RL)
- Risk Limit levels provide predefined invalidation zones where market participants can objectively assess whether the current structure remains intact.
- Having clearly defined risk areas helps maintain disciplined decision-making during volatile moves.
Phase 2: 250 Points Long Move (TBTS + CR)
Key Levels Observed
- ME-1 (Market Equilibrium @ 23356.80)
- ME-2 (Market Equilibrium @ 23406.80)
- ME-3 (Market Equilibrium @ 23456.80)
- ME-4 (Market Equilibrium @ 23506.80)
- ME-5 (Market Equilibrium @ 23556.80)
- L React (Long Price Reaction @ 23306.80)
- RL (Risk Limit @ 23276.80)
Understanding the Structure
Market Equilibrium (ME) Levels
- Successive equilibrium levels often indicate a structured expansion phase where price continues accepting higher value areas.
- These levels create an organized framework for monitoring continuation, pauses, and momentum shifts.
Price Reaction Zones
- Reaction zones highlight locations where price responds strongly after reaching key references.
- Such areas become important markers for evaluating participation and understanding whether initiative activity continues.
Risk Limit (RL)
- Risk limits define boundaries where the structural assumptions of the move may no longer remain valid.
- Maintaining clearly identified risk references helps traders objectively interpret market conditions without emotional decision-making.
Final Educational Observation
This session highlighted how combining VC, TBTS, and CR can provide a structured framework for identifying equilibrium shifts, reaction zones, and risk boundaries. Rather than focusing only on price movement, understanding how these components interact provides deeper insight into market behavior and developing auction dynamics.Maximize Your Trading Edge with Bell Orderflow Ultimate Visit www.belltpo.com or reach out to us for more details.