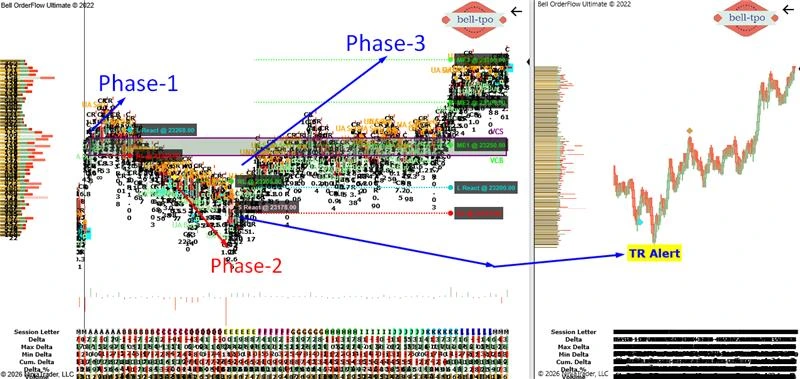
Educational Takeaway: Net 90 Points Move captured in NIFTY_I with VC + TR + TBTS + UA + CR using Bell Orderflow Ultimate
This session demonstrated how VC, TR, TBTS, UA, and CR worked together to identify key reaction zones, equilibrium levels, and risk boundaries. By focusing on market structure rather than price alone, traders can better understand evolving auction dynamics.
Maximize Your Trading Edge with Bell Orderflow Ultimate Visit www.belltpo.com or reach out to us for more details.
Phase 1: 30 Points Risk Limit Hit (VC + CR)
L React (Long Price Reaction @ 23268.00)
- Price reaction zones highlight areas where participants actively respond to market conditions.
- These levels often become valuable references for future market behavior.
RL (Risk Limit @ 23238.00)
- Risk limits define the boundary where the current market structure may no longer remain valid.
- Clear risk references help maintain consistency and discipline.
Phase 2: 30 Points Risk Limit Hit (VC + CR)
S React (Short Price Reaction @ 23178.00)
- Reaction zones indicate areas where market participants become highly active.
- These references help assess whether momentum is being accepted or absorbed.
RL (Risk Limit @ 23208.00)
- Risk limits provide objective levels for evaluating structural integrity.
- Well-defined risk zones help reduce emotional decision-making.
Phase 3: 150 Points Long Move (TR + TBTS + UA + CR)
ME-1 (Market Equilibrium @ 23250.00)
- ME-1 established the first equilibrium reference during the expansion phase.
- Initial equilibrium levels help identify the beginning of value migration.
ME-2 (Market Equilibrium @ 23300.00)
- ME-2 showed continued acceptance as price progressed higher.
- Successive equilibrium formations often indicate organized participation.
ME-3 (Market Equilibrium @ 23350.00)
- ME-3 reflected further development of value within the ongoing move.
- Multiple equilibrium references help track auction progression.
L React (Long Price Reaction @ 23200.00)
- Price reaction areas reveal locations where participants respond aggressively.
- These levels often serve as important structural reference points.
RL (Risk Limit @ 23170.00)
- Risk limits identify levels where assumptions about the current structure may change.
- Objective risk references improve market interpretation and consistency.
Final Educational Observation
This session showcased how the combination of VC, TR, TBTS, UA, and CR can help identify key reaction zones, equilibrium development, and risk boundaries. Understanding these relationships provides valuable insight into market structure and auction behavior.Maximize Your Trading Edge with Bell Orderflow Ultimate Visit www.belltpo.com or reach out to us for more details.