Educational Takeaway: Net 300 Points Move Captured in NIFTY_I with VC + CR using Bell Orderflow Ultimate
The recent move in NIFTY_I demonstrated how structured orderflow and equilibrium-based analysis can help traders understand directional momentum with clarity. Using the VC + CR framework from Bell Orderflow Ultimate, the market delivered a clean 300-point move while respecting key reaction and equilibrium zones throughout the session.
Instead of reacting emotionally to volatility, traders could observe how price behaved around predefined levels and how market participation shifted as equilibrium zones continued to migrate lower.
Maximize Your Trading Edge with Bell Orderflow Ultimate Visit www.belltpo.com or reach out to us for more details.
Phase 1 – Structured 300 Points Move
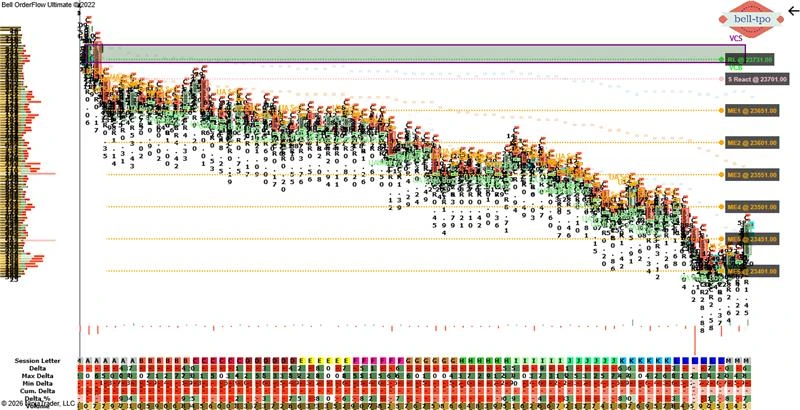
RL (Risk Limit @ 23731.00)
- The Risk Limit zone acted as the first important control area where volatility expansion began to increase.
- This level helped traders understand the boundary where market conditions started favoring aggressive directional movement.
- Risk Limit levels are useful in identifying whether price is accepting or rejecting higher value areas.
- When price sustains beyond these zones, it often indicates stronger conviction from market participants.
S React (Short Price Reaction @ 23701.00)
- The Price Reaction zone provided the first clear indication of directional participation entering the market.
- This area highlighted a strong reaction where momentum started building with increased efficiency.
- Price Reaction levels help traders understand where active market response is taking place.
- Such reactions often become important references for continuation or intraday control shifts.
ME-1 (Market Equilibrium @ 23651.00)
- ME-1 represented the first equilibrium transition after the initial reaction phase.
- The market showed orderly acceptance around this zone before continuing toward lower equilibrium areas.
- Market Equilibrium levels help identify balance points between opposing participants.
- When price starts accepting below equilibrium, it often reflects continued directional pressure.
ME-2 (Market Equilibrium @ 23601.00)
- ME-2 acted as another structured balance area during the move.
- The market continued respecting equilibrium shifts without creating major reversals.
- Equilibrium zones are important because they reveal how value migrates during trending conditions.
- Sustained movement between equilibrium levels often reflects healthy market continuation.
ME-3 (Market Equilibrium @ 23551.00)
- ME-3 highlighted continued acceptance in the lower value region.
- The market maintained clean structure while reacting efficiently around this equilibrium zone.
- These equilibrium references help traders avoid emotional decision-making during fast-moving conditions.
- They also provide a framework for tracking market strength phase by phase.
ME-4 (Market Equilibrium @ 23501.00)
- ME-4 became another important distribution area where price briefly stabilized before extending further.
- The market continued showing strong efficiency with limited counter reactions around this zone.
- Market Equilibrium levels often act as temporary balancing points during directional sessions.
- Understanding these balance areas helps traders interpret whether momentum is weakening or sustaining.
ME-5 (Market Equilibrium @ 23451.00)
- ME-5 reflected continued lower value acceptance as the session progressed.
- The structure remained orderly, indicating strong directional participation within the move.
- Equilibrium migration is one of the key observations in orderflow-based analysis.
- Consistent migration across multiple equilibrium zones usually indicates stronger market conviction.
ME-6 (Market Equilibrium @ 23401.00)
- ME-6 marked the final major equilibrium reference during the 300-point move.
- The market maintained directional efficiency while respecting lower balance zones into the session close.
- Final equilibrium zones often help traders assess exhaustion versus continuation behavior.
- Observing how price behaves near these levels can provide valuable insight into future sessions.
Conclusion
This session demonstrated how VC + CR concepts combined with equilibrium analysis can provide a structured view of market movement. Instead of relying on guesswork, traders could track value migration, reaction zones, and equilibrium acceptance step by step throughout the move. Bell Orderflow Ultimate helps traders visualize these important market dynamics in real time, making it easier to understand participation, balance, and momentum behavior during volatile trading sessions.Maximize Your Trading Edge with Bell Orderflow Ultimate Visit www.belltpo.com or reach out to us for more details.