Educational Takeaway: Net 250 Points Move Captured in NIFTY_I with VC + TBTS + TR + CR Using Bell Orderflow Ultimate

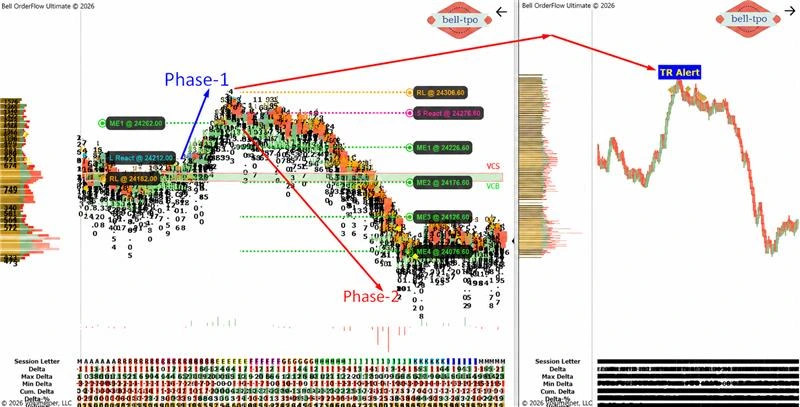
The NIFTY_I session demonstrated how Bell Orderflow Ultimate identified a structured 250-point market move using the combined strength of VC, TBTS, TR, and CR. The session developed across two distinct phases, where predefined Price Reaction, Risk Limit, and Market Equilibrium levels provided an objective framework for studying price progression and evolving market structure.
This analysis is shared purely for educational purposes to demonstrate how different Bell Orderflow Ultimate concepts can be interpreted together.
The key educational takeaway is how predefined Price Reaction, RL, and successive ME levels helped divide the overall movement into measurable stages, providing an objective framework for studying market structure and price progression.
Maximize Your Trading Edge with Bell Orderflow Ultimate
Visit www.belltpo.com or reach out to us for more details.
This analysis is shared purely for educational purposes to demonstrate how different Bell Orderflow Ultimate concepts can be interpreted together.
Phase 1 – 50 Points Market Move (VC + CR)
L React (Price Reaction @ 24212.00)
- This Price Reaction level established the initial Orderflow reference for Phase 1.
- It provided an objective starting point for monitoring the subsequent price progression toward the predefined equilibrium reference.
RL (Risk Limit @ 24182.00)
- This Risk Limit level established the predefined structural boundary for Phase 1.
- The 30-point distance between the Price Reaction and RL provided a clearly defined framework for disciplined risk management.
ME-1 (Market Equilibrium @ 24262.00)
- ME-1 represented the Market Equilibrium reference reached during the first phase.
- The progression from the Price Reaction at 24212.00 to ME-1 at 24262.00 completed a structured 50-point market move.
Phase 2 – 200 Points Market Move (TR + TBTS + CR)
S React (Price Reaction @ 24276.60)
- This Price Reaction level established the primary Orderflow reference for Phase 2.
- The alignment of TR, TBTS, and CR provided a structured framework for studying the subsequent market progression.
RL (Risk Limit @ 24306.60)
- This Risk Limit level established the predefined structural boundary for the second phase.
- The 30-point distance between the Price Reaction and RL provided an objective reference for evaluating whether the developing structure remained valid.
ME-1 (Market Equilibrium @ 24226.60)
- ME-1 represented the first Market Equilibrium reference reached during Phase 2.
- This level marked the first 50-point progression from the initial Price Reaction reference.
ME-2 (Market Equilibrium @ 24176.60)
- ME-2 represented the next equilibrium reference within the developing market structure.
- The progression from ME-1 to ME-2 provided another measurable checkpoint for studying price development.
ME-3 (Market Equilibrium @ 24126.60)
- ME-3 represented the third equilibrium reference reached during the phase.
- Successive equilibrium levels provided a structured way to observe the progression of the larger market move.
ME-4 (Market Equilibrium @ 24076.60)
- ME-4 represented the final Market Equilibrium reference reached during Phase 2.
- The progression from 24276.60 through the successive ME levels to 24076.60 completed a structured 200-point market move.
Key Learning
This NIFTY_I session demonstrates how VC, TBTS, TR, and CR can be studied alongside predefined Price Reaction, RL, and ME levels. Rather than interpreting individual levels in isolation, the two phases provide a structured framework for observing how price progressed from one Orderflow reference to another.The key educational takeaway is how predefined Price Reaction, RL, and successive ME levels helped divide the overall movement into measurable stages, providing an objective framework for studying market structure and price progression.
Maximize Your Trading Edge with Bell Orderflow Ultimate
Visit www.belltpo.com or reach out to us for more details.