Educational Takeaway: Net 70 Points Move Captured in NIFTY_I with VC + TBTS + CR using Bell Orderflow Ultimate

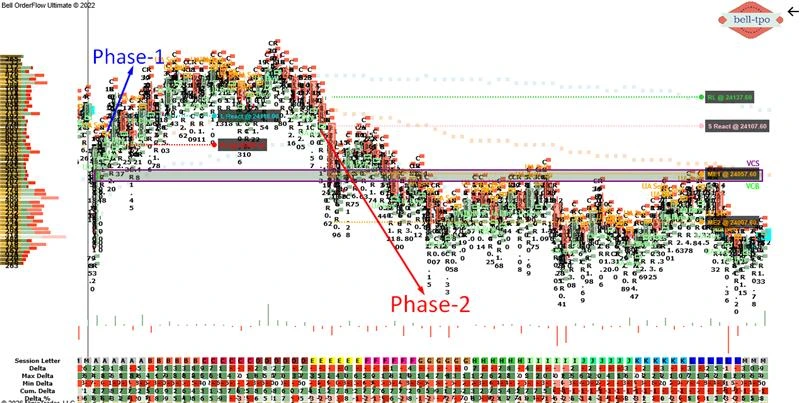
Understanding how price behaves around reaction zones, equilibrium levels, and defined risk boundaries is key to structured trading. This example highlights how a combination of VC, TBTS, and CR helped identify both opportunity and risk clearly across two phases.
Maximize Your Trading Edge with Bell Orderflow Ultimate Visit www.belltpo.com or reach out to us for more details.
Phase 1: 30 Points Risk Limit Hit
Price Reaction (L React @ 24118.00)
- The initial long price reaction indicated early responsive interest at this level. However, the follow-through lacked strength, reflecting weak continuation.
- This type of reaction often suggests responsive activity rather than strong initiative participation. It requires confirmation before expecting sustained movement.
Risk Limit (RL @ 24088.00)
- The predefined risk limit acted as a clear boundary for the trade idea. Once breached, it confirmed that the expected directional conviction was not holding.
- Respecting this level helps prevent deeper drawdowns and keeps decision-making rule-based instead of emotional.
Market Equilibrium (ME Levels)
- No ME levels were established in this phase, indicating the market did not accept value in this region. The absence of balance suggested instability and lack of structure.
- This typically reflects a transition phase where one side fails before the other takes control.
Phase 2: 100 Points Short Move (TBTS + CR)
Price Reaction (S React @ 24107.60)
- A strong short price reaction emerged, indicating aggressive responsive pressure entering the market. This reaction showed clear intent compared to the earlier phase.
- Such reactions often reflect initiative activity, where participants are confident about direction and push price efficiently.
Risk Limit (RL @ 24137.60)
- The risk limit provided a well-defined invalidation point for the setup. Price staying below this level reinforced the directional structure.
- Maintaining discipline around this level ensures controlled exposure while allowing the move to develop.
Market Equilibrium (ME-1 @ 24057.60, ME-2 @ 24007.60)
- ME-1 acted as the first balance zone where price paused, showing temporary acceptance. This level often serves as a checkpoint before continuation.
- ME-2 reflected deeper value acceptance, confirming sustained control and a structured move. Multiple equilibrium levels indicate a healthy directional auction.
Key Learning
- Not all reactions lead to continuation; context and follow-through matter.
- Risk limits define survival and consistency more than entry precision.
- Multiple equilibrium levels indicate structured moves with higher clarity.
Maximize Your Trading Edge with Bell Orderflow Ultimate Visit www.belltpo.com or reach out to us for more details.