Educational Takeaway: Net 320 Points Captured in NIFTY_I with VC + TR + TBTS + CR using Bell Orderflow Ultimate

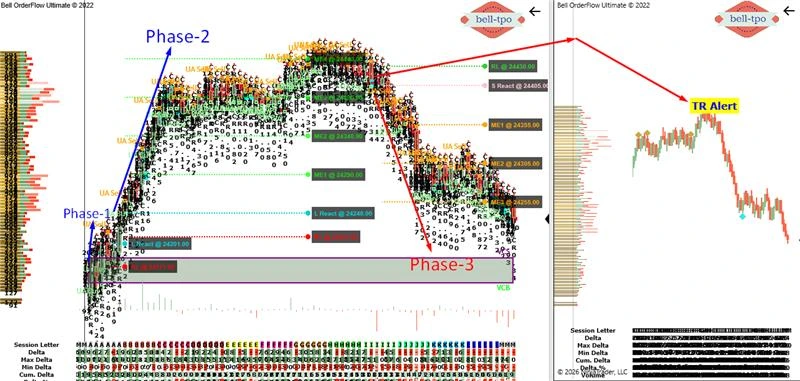
Understanding how price behaves around key Orderflow concepts like VC, TR, TBTS, and CR can significantly improve intraday decision-making. This case study highlights how structured reactions at critical levels helped map a 320-point opportunity in NIFTY_I, with each phase driven by 2–3 concepts that strengthened the overall move.
Maximize Your Trading Edge with Bell Orderflow Ultimate Visit www.belltpo.com or reach out to us for more details.
Phase 1: Initial Reaction – Early Structure Test
The session opened with a Long Price Reaction at 24201.00, showing initial responsiveness at lower levels. However, the move lacked continuation and quickly tested the Risk Limit at 24171.00, indicating weak follow-through.- Price reactions reflect how the market responds at important levels, helping identify early intent. When follow-through is missing, it often indicates lack of strength in the current direction.
- Risk limits define the boundary where the structure is no longer valid. Respecting these levels ensures discipline and prevents exposure during uncertain conditions.
Phase 2: Structured Expansion – Strong Directional Flow
With alignment of VC + CR concepts, the market transitioned into a strong directional phase. The Long Price Reaction at 24240.00 confirmed strength, while the Risk Limit at 24210.00 maintained structural integrity throughout the move. Market Equilibrium levels at 24290, 24340, 24390, and 24440 acted as step-by-step checkpoints during the expansion. These levels help track how the market builds value as it progresses.- ME levels indicate where the market pauses, accepts, or continues, offering a clear structure within a trend. Sustained movement through these levels reflects strong participation and directional clarity.
- Price reactions during such phases validate continuation when aligned with supporting concepts. Risk limits ensure the structure remains intact and provide a clear invalidation point if conditions change.
Phase 3: Reversal Structure – Controlled Move Lower
As the market approached higher levels, alignment of TR + TBTS + CR concepts confirmed a shift in structure. The Short Price Reaction at 24405.00 marked the beginning of downside pressure, with the Risk Limit at 24430.00 defining the invalidation zone. Market Equilibrium levels at 24355, 24305, and 24255 guided the move lower, acting as reference points for value transition. These levels helped track how efficiently the market accepted lower prices.- ME levels during a downward phase highlight how smoothly value shifts to lower zones. Clean acceptance across these levels reflects strong directional control.
- Price reactions at elevated levels often indicate exhaustion when supported by multiple concepts. Risk limits remain essential to quickly identify if the structure fails or loses momentum.
Key Learning
This structured sequence shows how combining 2–3 concepts per phase with clear level-based interpretation can map high-probability opportunities. The ability to read price reactions, track equilibrium shifts, and respect risk boundaries builds a disciplined and repeatable approach.Maximize Your Trading Edge with Bell Orderflow Ultimate Visit www.belltpo.com or reach out to us for more details.