Educational Takeaway: Net 390 Points Move Captured in NIFTY_I with VC + MR + TBTS + CR using Bell Orderflow Ultimate

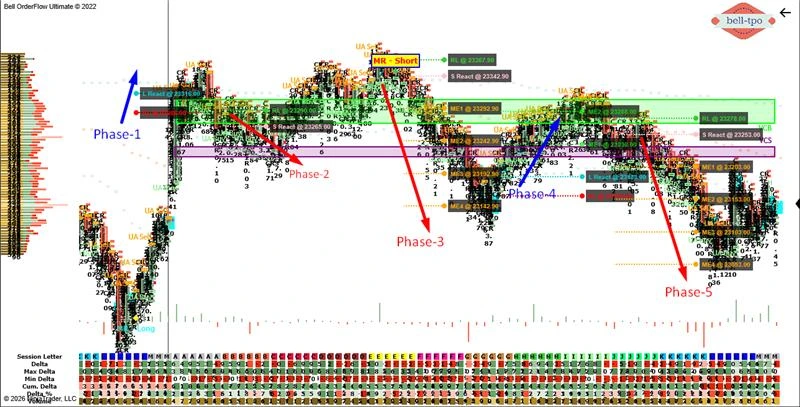
This case study showcases a 390-point structured move in NIFTY_I, driven by a combination of VC, MR, TBTS, and CR signals. The movement unfolds across multiple phases, highlighting how price interacts with Market Equilibrium (ME), Reaction levels, and Risk Limits (RL) to form a clear and disciplined framework.
Maximize Your Trading Edge with Bell Orderflow Ultimate Visit www.belltpo.com or reach out to us for more details.
Phase 1: 30 Points Risk Limit Hit
ME Levels
- No Market Equilibrium levels were formed in this phase, indicating the absence of structured continuation. This reflects an unstable environment where price did not establish balance.
- The lack of ME zones suggests that the move was short-lived and lacked directional clarity. It emphasizes the importance of waiting for structured setups.
L React (Long Price Reaction @ 23316.00)
- The long price reaction indicated an attempt to push price higher from this level. It showed initial strength but lacked the continuation needed to sustain the move.
- This reaction remained isolated without structural backing. It highlighted how standalone reactions may not lead to extended movement.
RL (Risk Limit @ 23286.00)
- Risk Limit was triggered quickly, marking invalidation of the structure. It clearly defined the boundary beyond which the setup failed.
- This level reinforced disciplined risk management. It ensured that weak structures were identified early.
Phase 2: 30 Points Risk Limit Hit
ME Levels
- No Market Equilibrium levels developed in this phase, again indicating a lack of structured movement. Price did not establish a stable range or continuation pattern.
- This absence highlights a transition phase where conditions were not favorable for sustained movement. It reinforces the importance of structure-based analysis.
S React (Short Price Reaction @ 23265.00)
- The short price reaction indicated resistance at higher levels. It showed a response from the market but lacked follow-through.
- This reaction provided a signal of pressure but without continuation. It remained a standalone response within an unstructured phase.
RL (Risk Limit @ 23290.00)
- Risk Limit was hit, confirming the failure of the setup. It marked the boundary where the structure lost validity.
- This level helped maintain discipline during uncertain conditions. It ensured quick identification of invalid phases.
Phase 3: 200 Points Short Move (MR + TBTS + CR)
ME-1 to ME-4 (23292.90 → 23142.90)
- A sequence of Market Equilibrium levels formed a strong, structured pathway. Price moved systematically across these levels, indicating sustained control.
- These ME levels acted as stepping stones, guiding the move with clarity. Their alignment reflected a high-confidence directional phase.
S React (Short Price Reaction @ 23342.90)
- The short price reaction confirmed strong participation at higher levels. It aligned with the continuation of the broader structure.
- This reaction level acted as a trigger for momentum. It highlighted active engagement supporting the move.
RL (Risk Limit @ 23367.90)
- Risk Limit defined the upper boundary of the phase, ensuring structural clarity. It acted as a control point for maintaining discipline.
- This level reinforced the framework within which price operated. It ensured the move remained well-defined and controlled.
Phase 4: 100 Points Long Move (TBTS + CR)
ME-2 & ME-1 (23288.00 → 23238.00)
- Market Equilibrium levels acted as rotational zones where price transitioned smoothly. They provided a structured pathway for movement within this phase.
- These levels indicated areas of balance and acceptance. They helped track how price maintained structure during the move.
L React (Long Price Reaction @ 23188.00)
- The long price reaction showed strong responsiveness from lower levels. It indicated active participation supporting upward movement.
- This reaction level helped validate the phase structure. It reflected momentum building from key zones.
RL (Risk Limit @ 23158.00)
- Risk Limit defined the lower boundary, ensuring clarity in the structure. It marked the point beyond which the phase would lose strength.
- This level acted as a safeguard for maintaining discipline. It reinforced structured tracking of price movement.
Phase 5: 150 Points Short Move (VC + CR)
ME-1 to ME-3 (23203.00 → 23103.00)
- A clean sequence of Market Equilibrium levels provided a structured continuation path. Price moved efficiently across these zones, reflecting strong control.
- These ME levels acted as reference checkpoints for tracking progression. Their alignment confirmed a well-organized phase.
S React (Short Price Reaction @ 23253.00)
- The short price reaction confirmed renewed pressure at higher levels. It aligned with the continuation of the broader structure.
- This reaction level highlighted active participation and momentum. It served as a key confirmation within the phase.
RL (Risk Limit @ 23278.00)
- Risk Limit defined the upper boundary, ensuring that the structure remained controlled. It marked the threshold where the phase would weaken.
- This level reinforced disciplined execution. It ensured clarity in identifying structural limits.
Key Learning
- Structured ME sequences indicate strong and sustained movement.
- Reaction levels highlight where price responds most actively.
- Risk Limits are critical for defining boundaries and managing invalidation.
- Phases without ME levels often indicate weak or unstable conditions.
Maximize Your Trading Edge with Bell Orderflow Ultimate Visit www.belltpo.com or reach out to us for more details.