Educational Takeaway: Net 240 Points Move Captured in NIFTY_I with VC + TR + CR + TBTS + UA using Bell Orderflow Ultimate

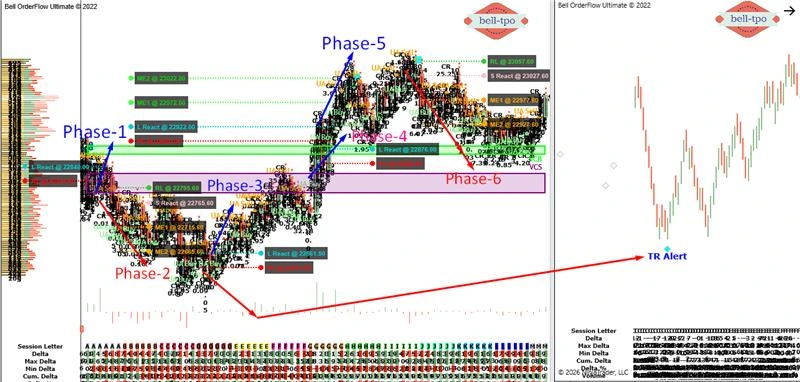
Understanding market structure through Orderflow gives traders a powerful edge. This session in NIFTY_I demonstrates how combining VC + TR + CR + TBTS + UA can help decode price behavior across multiple phases — capturing a net 240-point move with controlled risk.
Maximize Your Trading Edge with Bell Orderflow Ultimate Visit www.belltpo.com or reach out to us for more details.
Phase 1: Initial Reaction & Risk Test (30 Points Risk Limit Hit)
L React (Long Price Reaction @ 22840.00)
- Price showed a strong reaction from this level, indicating responsive interest.
- Such reactions often highlight the presence of short-term support zones.
RL (Risk Limit @ 22810.00)
- This level defines the maximum acceptable adverse movement for the setup.
- Once breached, it signals that the initial premise is invalidated.
Phase 2: Strong Directional Move (100 Points Move | VC + CR)
S React (Short Price Reaction @ 22765.60)
- Price reacted sharply from this level, confirming active responsive pressure.
- This type of reaction typically aligns with continuation behavior.
ME-1 (Market Equilibrium @ 22715.60)
- Acts as a balance zone where price temporarily stabilizes before continuation.
- Helps in identifying intraday fair value during trending conditions.
ME-2 (Market Equilibrium @ 22665.60)
- Represents deeper equilibrium where opposing participants reassess positions.
- Often serves as a key level for continuation or reversal decision.
RL (Risk Limit @ 22795.60)
- This level marks the threshold where the trade idea loses its structure.
- Maintaining discipline around this ensures controlled exposure.
Phase 3: Reaction Failure (30 Points Risk Limit Hit)
L React (Long Price Reaction @ 22661.50)
- Price attempted to respond upward from this level.
- However, the follow-through was insufficient to sustain momentum.
RL (Risk Limit @ 22631.50)
- Defines the boundary where the expected reaction failed.
- Breaking this level confirms weakness in the setup.
Phase 4: Another Reaction Failure (30 Points Risk Limit Hit)
L React (Long Price Reaction @ 22876.00)
- Price again showed a reaction, indicating participants attempting control.
- But the structure lacked strength for continuation.
RL (Risk Limit @ 22846.00)
- Serves as a clear invalidation level for the setup.
- Respecting this prevents unnecessary drawdowns.
Phase 5: Strong Recovery Move (100 Points Move | VC + CR)
L React (Long Price Reaction @ 22922.00)
- Price reacted strongly, confirming renewed responsive interest.
- This reaction aligned well with structural support.
ME-1 (Market Equilibrium @ 22972.00)
- Acts as an intermediate balance zone during upward movement.
- Helps track acceptance of higher prices.
ME-2 (Market Equilibrium @ 23022.00)
- Represents higher value acceptance in the market.
- Indicates strength when price sustains above this level.
RL (Risk Limit @ 22892.00)
- Marks the invalidation point for the upward structure.
- Ensures risk is predefined and controlled.
Phase 6: Exhaustion & Reversal Concept (TBTS + CR + UA)
S React (Short Price Reaction @ 23027.60)
- Price showed a reaction indicating responsive interest at higher levels.
- This often signals exhaustion after an extended move.
ME-1 (Market Equilibrium @ 22977.60)
- Acts as a transition zone where momentum begins to shift.
- Helps identify potential change in direction.
ME-2 (Market Equilibrium @ 22927.60)
- Represents a deeper balance zone during reversal phases.
- Breaks below this often confirm continuation of the new move.
RL (Risk Limit @ 23057.60)
- Defines the invalidation level for the reversal structure.
- Maintains discipline during volatile conditions.
Key Learning
- Markets move in phases of reaction, equilibrium, and expansion.
- Risk Limits (RL) are critical to survival and consistency.
- Market Equilibrium (ME) helps identify fair value zones.
- Price Reactions (L React / S React) reveal participation of opposing participants.
- Combining multiple signals (VC + TR + CR + TBTS + UA) improves decision quality.
Conclusion
This example clearly demonstrates how structured Orderflow analysis can help decode market behavior step by step. Instead of guessing direction, the focus remains on reading reactions, managing risk, and understanding equilibrium shifts.Maximize Your Trading Edge with Bell Orderflow Ultimate Visit www.belltpo.com or reach out to us for more details.