Educational Takeaway: Net 240 Points Captured in NIFTY_I with VC + TBTS + CR using Bell Orderflow Ultimate

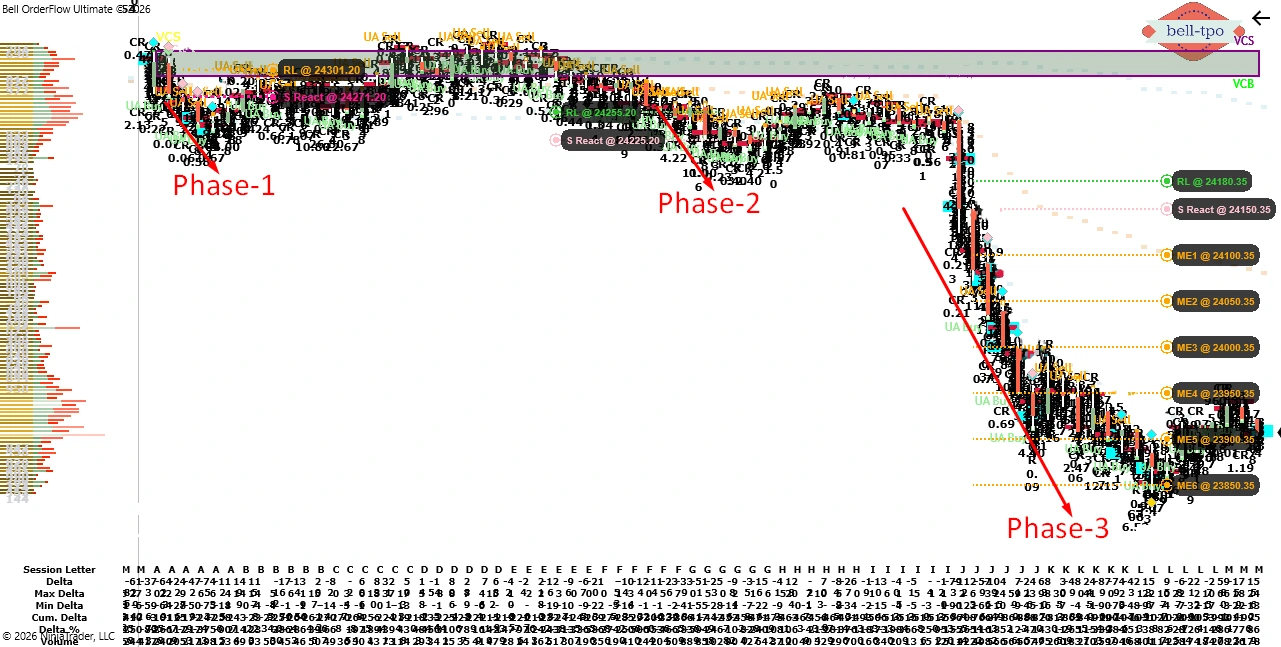
The following chart highlights how Bell Orderflow Ultimate identified a structured directional move in NIFTY_I using the combined strength of VC, TBTS, and CR. The session progressed through multiple phases, where predefined RL, S React, and ME levels provided an objective framework for interpreting market structure. This analysis is shared purely for educational purposes to demonstrate how different Bell Orderflow Ultimate concepts can be interpreted together.
Maximize Your Trading Edge with Bell Orderflow Ultimate
Visit www.belltpo.com or reach out to us for more details.
Phase 1 – 30 Points Risk Limit Event
RL (Risk Limit @ 24301.20)
- The Risk Limit defined the price level where the prevailing market expectation required reassessment.
- Using predefined Risk Limits helps maintain disciplined analysis and structured decision-making.
S React (Short Price Reaction @ 24271.20)
- The Short Price Reaction highlighted an important Orderflow reference level where price responded after rejecting higher levels.
- Respecting this level provided an objective reference for monitoring the continuation of the prevailing market structure.
Phase 2 – 30 Points Risk Limit Event
RL (Risk Limit @ 24255.20)
- The updated Risk Limit established a new predefined reference as the market structure evolved.
- It helped maintain disciplined risk management while allowing the directional structure to develop naturally.
S React (Short Price Reaction @ 24225.20)
- Price once again respected the Short Price Reaction level, reinforcing the importance of monitoring predefined Orderflow reference zones.
- Repeated reactions at these levels help traders objectively evaluate the continuity of market structure.
Phase 3 – 300 Points Directional Move (VC + TBTS + CR)
RL (Risk Limit @ 24180.35)
- The Risk Limit continued to define the maximum acceptable adverse movement while the market structure remained valid.
- Maintaining price within the predefined framework supported the continuation of the directional move.
S React (Short Price Reaction @ 24150.35)
- The Short Price Reaction acted as an important confirmation level before the market extended further.
- Respecting this level reinforced the continuation observed during the session.
ME-1 (Market Equilibrium @ 24100.35)
- ME-1 represented the first important balance zone reached during the move.
- It provided an objective reference for monitoring price acceptance.
ME-2 (Market Equilibrium @ 24050.35)
- ME-2 demonstrated continued acceptance as the market progressed through successive equilibrium zones.
- These structured reference levels help traders objectively monitor directional development.
ME-3 (Market Equilibrium @ 24000.35)
- ME-3 represented another important equilibrium reference during the extended move.
- Sustained movement through this level reflected an orderly market structure.
ME-4 (Market Equilibrium @ 23950.35)
- ME-4 highlighted another important equilibrium zone as the market continued progressing.
- Successive equilibrium levels provide objective checkpoints for interpreting market behavior.
ME-5 (Market Equilibrium @ 23900.35)
- Price continued respecting the Market Equilibrium framework throughout the directional move.
- Each equilibrium level offered an objective reference instead of relying on subjective analysis.
ME-6 (Market Equilibrium @ 23850.35)
- ME-6 marked the final equilibrium level reached during this extended session.
- The sequence of equilibrium levels demonstrated how Bell Orderflow Ultimate helps visualize evolving market structure.
Key Learning
When VC, TBTS, and CR align with ME, S React, and RL, they provide a structured framework for studying market behavior. Rather than relying on subjective interpretation, predefined Orderflow reference levels help traders objectively understand evolving market structure while maintaining disciplined risk management.Maximize Your Trading Edge with Bell Orderflow Ultimate
Visit www.belltpo.com or reach out to us for more details.