Educational Takeaway: Yesterday Net 120 Points Move Captured in NIFTY_I with MR + TR + CR using Bell Orderflow Ultimate
The following educational case study demonstrates how the MR , TR , and CR concepts in Bell Orderflow Ultimate identified multiple high-probability market reaction zones during the session. This analysis is shared purely for educational purposes to explain how price interacted with predefined Orderflow levels.
Maximize Your Trading Edge with Bell Orderflow Ultimate
Visit http://www.belltpo.com or reach out to us for more details.
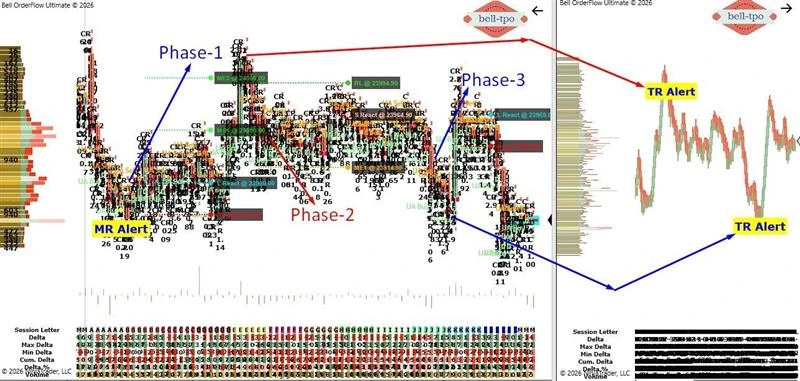
Phase 1 – 150-Point Upward Price Movement (MR + CR)
Price initially stabilized around the Long Price Reaction zone and respected the predefined Risk Limit, indicating that selling pressure was getting absorbed. The subsequent price movement validated the strength of the reaction and continued higher toward the Market Equilibrium levels.L React (Long Price Reaction @ 23900.00)
- The Long Price Reaction acted as the first important decision area where buyers showed strong participation.
- Once price sustained above this level, it confirmed a healthy continuation of the upward move.
RL (Risk Limit @ 23870.00)
- The Risk Limit defined the maximum acceptable adverse movement for this educational setup.
- As long as price remained above this level, the bullish structure stayed intact and supported the continuation.
Market Equilibrium Levels
ME-1 (Market Equilibrium @ 23950.00)
- ME-1 represented the initial balance zone where price often pauses or consolidates.
- After maintaining strength above ME-1, price continued toward the next equilibrium level.
ME-2 (Market Equilibrium @ 24000.00)
- ME-2 served as the next Market Equilibrium objective.
- Price successfully reached this level, completing an approximate 150-point upward move.
Phase 2 – 50-Point Downward Price Movement (TR + CR)
Following the completion of the earlier move, market conditions shifted and a Trend Reversal setup emerged. Price reacted from the predefined levels and moved toward the lower Market Equilibrium area.S React (Short Price Reaction @ 23964.90)
- The Short Price Reaction served as the primary resistance area where selling pressure emerged.
- Price respected this level and began moving lower, validating the reaction.
RL (Risk Limit @ 23994.90)
- The Risk Limit acted as the protective boundary for the bearish structure.
- Remaining below this level kept the downward momentum intact throughout the move.
ME-1 (Market Equilibrium @ 23914.90)
- ME-1 represented the next important Market Equilibrium zone during the decline.
- Price successfully reached this level, completing an approximate 50-point downward movement.
Phase 3 – Stop-Loss Scenario (Educational Example)
Not every setup results in an extended move, and disciplined risk management remains an essential part of trading. This phase demonstrates how predefined risk parameters help control losses when market conditions fail to follow through.L React (Long Price Reaction @ 23965.00)
- The Long Price Reaction identified a potential area where buyers could regain control.
- However, price failed to sustain above this reaction level, indicating insufficient buying strength.
RL (Risk Limit @ 23935.00)
- The predefined Risk Limit was eventually breached, invalidating the setup.
- Respecting this level allowed the position to be exited systematically instead of allowing losses to increase.
Market Observation
- This example highlights that even well-defined Orderflow setups may not always succeed.
- Consistently respecting predefined Risk Limits helps maintain discipline and supports long-term trading consistency.
Conclusion
Bell Orderflow Ultimate combines ME Levels, Price Reaction, and Risk Limits to help traders objectively interpret market structure and identify potential reaction areas while maintaining disciplined risk management.Maximize Your Trading Edge with Bell Orderflow Ultimate
Visit http://www.belltpo.com or reach out to us for more details.