Massive 300-Point Move Captured in NIFTY_I with Bell Orderflow Ultimate
Massive 300-Point Move Captured in NIFTY_I with Bell Orderflow Ultimate 🔥📉
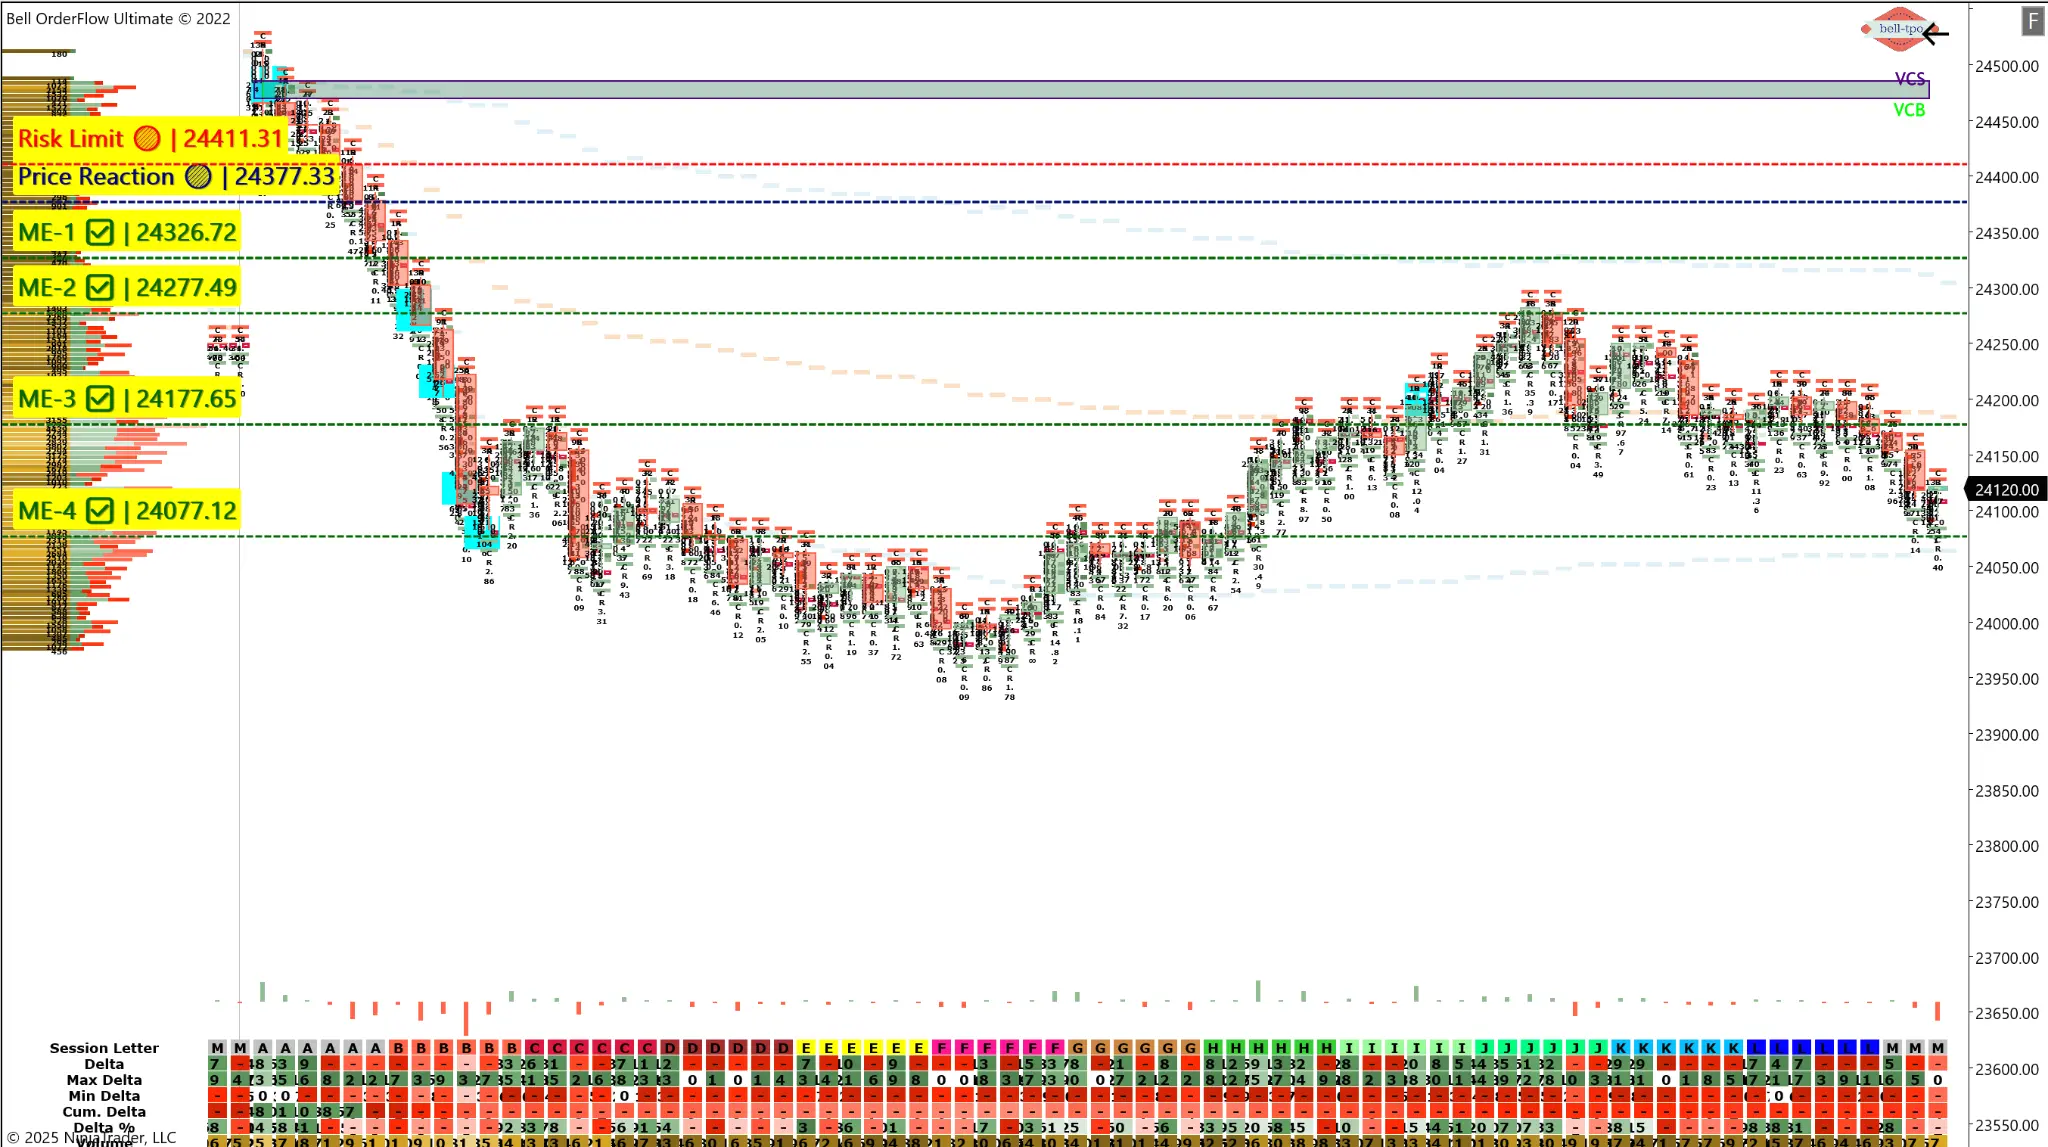
Following a clean structure and volume confirmation, today’s session in NIFTY_I delivered a massive 300-point move, tracked in real time using Bell Orderflow Ultimate. The price action kicked off from a sharp Price Reaction @ 24377.33, with the market breaking below the VC Zone, eventually slicing through all four Market Equilibrium (ME) levels.
This kind of directional clarity is exactly why traders rely on Bell Orderflow Ultimate to stay a step ahead. 📌✅
Key Developments Observed on the Bell Orderflow Ultimate Chart:
📍 Price Reaction @ 24377.33 – This was the first sign of supply stepping in, leading to a fast-paced move lower.
📉 Risk Limit @ 24411.31 – Price failed to hold above this line, confirming weakness early in the session.
Market Equilibrium Breakdown:
- ✅ ME-1 @ 24326.72 – Market failed to hold above this level, initiating the trend shift.
- ✅ ME-2 @ 24277.49 – Breakdown confirmed the selling strength and extended the move.
- ✅ ME-3 @ 24177.65 – Volume stacked lower, showing continued pressure.
- ✅ ME-4 @ 24077.12 – This was the last key equilibrium that gave way, completing the 300-point structure. ✅
Session Summary & Insights:
✅ 300-Point Downmove Captured from Price Reaction Zone✅ All Four ME Levels Broken with Volume Confirmation
✅ Risk Limit & VC Zone Marked the Start of the Fall
✅ Bell Orderflow Ultimate Delivered Real-Time Clarity and Direction
Today’s move in NIFTY_I was a textbook example of how Bell Orderflow Ultimate combines Price Reaction, VC Zones, and Market Equilibrium Levels to decode institutional activity and structural shifts. With each level confirming participation, traders had every opportunity to manage risk and maximize gains with confidence.
Unlock Precision Trading with Bell Orderflow Ultimate
Visit www.belltpo.com and elevate your strategy with tools that align with real market intent. 📲
🚨 Disclaimer:We are a software and indicator development company. This chart and analysis are for educational and informational purposes only. This is not investment advice or a recommendation to buy, sell, or trade any financial instrument. Users must conduct their own research before making any trading decisions. Past performance is not indicative of future results. ⚖️