ETHUSD: 180 Points Captured on 3rd October 2025 with Bell Orderflow Ultimate
The ETHUSD session on 3rd October 2025 showcased the precision of Bell Orderflow Ultimate in guiding traders through both bullish and bearish moves.
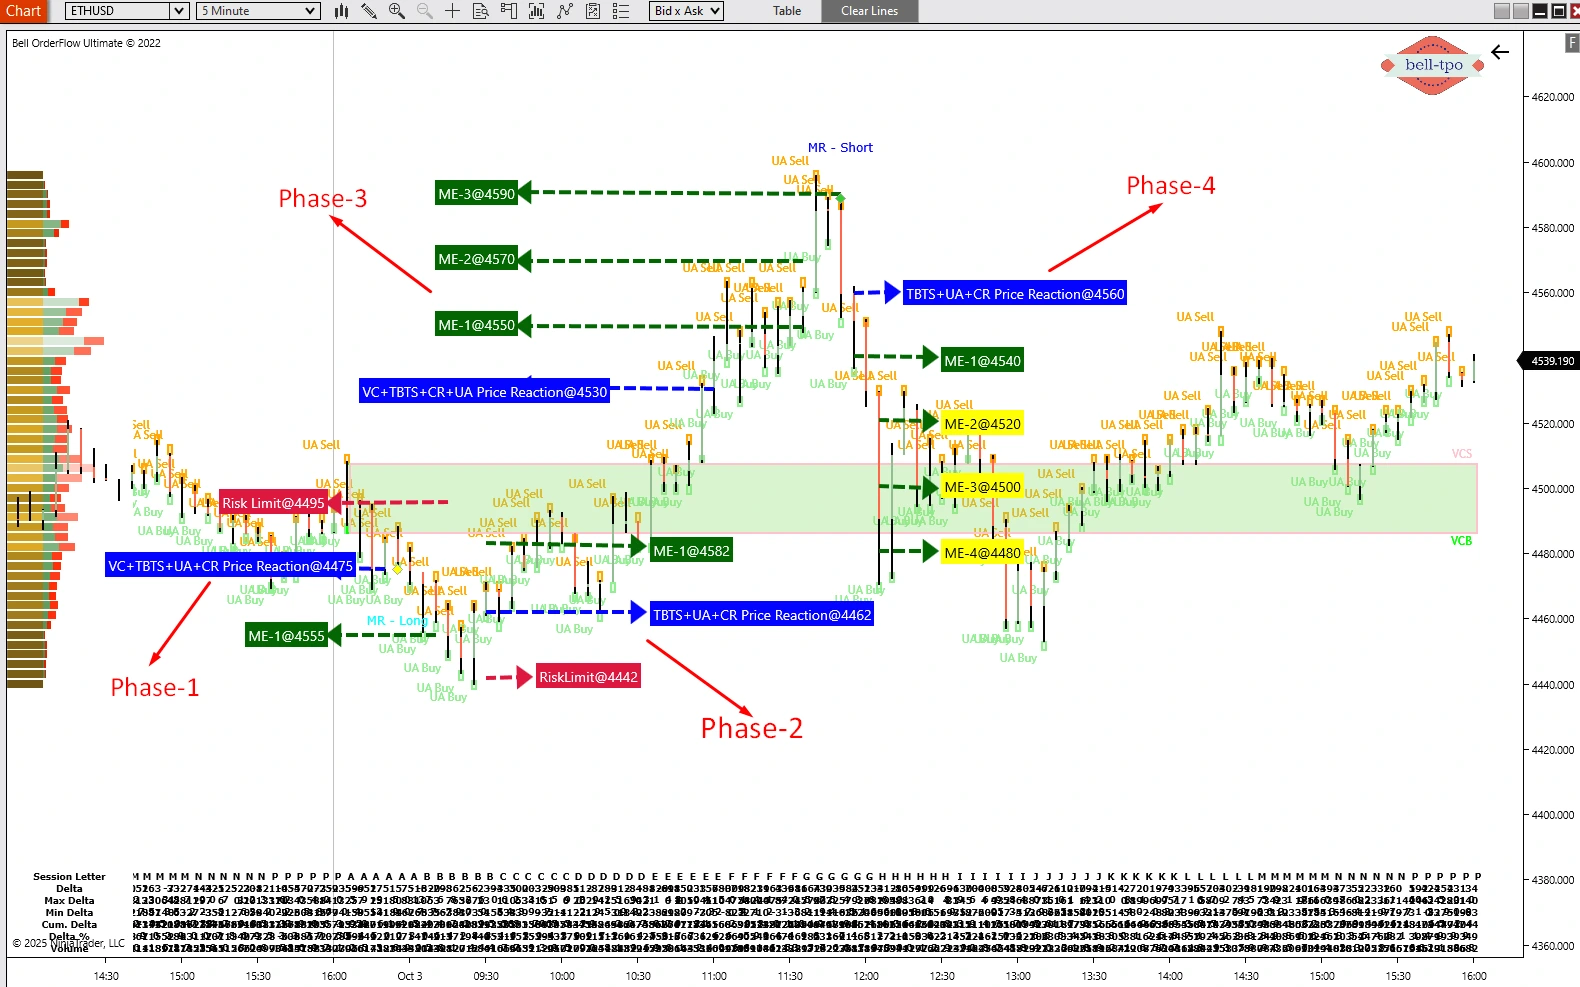
By leveraging VC Zone, TBTS (Trapped Buyers & Sellers), UA (Unfinished Auction), CR (Cot Ratio), and MR (Market Reversal) alerts, traders were able to navigate four distinct phases and capture a net 180 points with structure and clarity.
Phase-1: Downside Bias with VC + TBTS + UA + CR
The session started with a downside move, driven by aligned alerts from VC Zone, TBTS, UA, and CR, delivering 20 points.- Price Reaction @ 4475 → Marked the early auction pressure shift, signaling sellers gaining control at a critical reference point. Holding below this zone confirmed the downside bias.
- Risk Limit @ 4495 → Defined the upper protective boundary for the phase, indicating that a breach would invalidate the short-side setup.
- ME-1 @ 4555 → Served as the equilibrium checkpoint for the initial phase, guiding how far the downside move could be expected before a pause or shift.
Phase-2: Upside Move with TBTS + UA + CR
The market then transitioned into an upside move, supported by TBTS, UA, and CR, capturing another 20 points.- Price Reaction @ 4462 → Acted as the turning point where auction flow shifted back to buyers, initiating the upward continuation.
- Risk Limit @ 4442 → Provided a clear downside boundary, confirming that as long as the market stayed above it, the bullish bias remained intact.
- ME-1 @ 4582 → Reflected the equilibrium shift higher, validating that buyers had sustained control through this phase.
Phase-3: Second Upmove with VC + TBTS + UA + CR
A strong second leg of the upmove emerged with the combined confirmation from VC Zone, TBTS, UA, and CR, capturing 60 points.- Price Reaction @ 4530 → Defined the initiation zone for the second bullish leg, confirming renewed buyer participation.
- ME-1 @ 4550 → Marked the first progression checkpoint, reinforcing that the trend remained intact after the initial breakout.
- ME-2 @ 4570 → Indicated a stronger auction flow in favor of buyers, strengthening confidence to continue with the move.
- ME-3 @ 4590 → Served as the final upside checkpoint in this phase, reflecting a completed push by buyers.
Phase-4: Downside Reversal with TBTS + UA + CR + MR
The market finally reversed from the day’s high, driven by TBTS, UA, CR, and MR, capturing 80 points on the downside.- Price Reaction @ 4560 → Signaled the turning point where auction pressure shifted to sellers, beginning the reversal phase.
- ME-1 @ 4540 → Validated the initial equilibrium shift lower, confirming that sellers had gained control.
- ME-2 @ 4520 → Showed continuation strength for sellers, allowing the downside move to unfold smoothly.
- ME-3 @ 4500 → Reinforced bearish momentum as sellers held control deeper into the auction.
- ME-4 @ 4480 → Marked the final equilibrium checkpoint for this phase, highlighting the exhaustion point of the reversal move.
Net Outcome
- Phase-1: 20 points (downside)
- Phase-2: 20 points (upside)
- Phase-3: 60 points (second upside move)
- Phase-4: 80 points (downside reversal)
Key Takeaways
- Alerts from VC Zone, TBTS, UA, CR, and MR guided every phase with objective confirmation of auction pressure shifts.
- Price Reactions and Risk Limits defined the turning points and controlled exposure in both directions.
- ME Levels served as progressive checkpoints, mapping each phase’s structure and keeping traders aligned with market equilibrium.
This session proved that Bell Orderflow Ultimate’s alert-driven approach simplifies decision-making, turning complex market moves into clear, structured opportunities.
✅ Maximize Your Trading Edge with Bell Orderflow UltimateVisit www.belltpo.com to see how our alert-driven framework can help you achieve clarity and precision in volatile markets.
🚨 Disclaimer: We are a software and indicator development company. This chart and analysis are for educational and informational purposes only. It is not investment advice or a buy/sell recommendation. Trading in the securities market involves risks; users should conduct their own research or consult a SEBI-registered financial advisor before making trading or investment decisions. Past performance is not indicative of future results.