Educational Takeaway: Yesterday Net 190 Points Move Captured in NIFTY_I with VC + TBTS + CR + UA using Bell Orderflow Ultimate

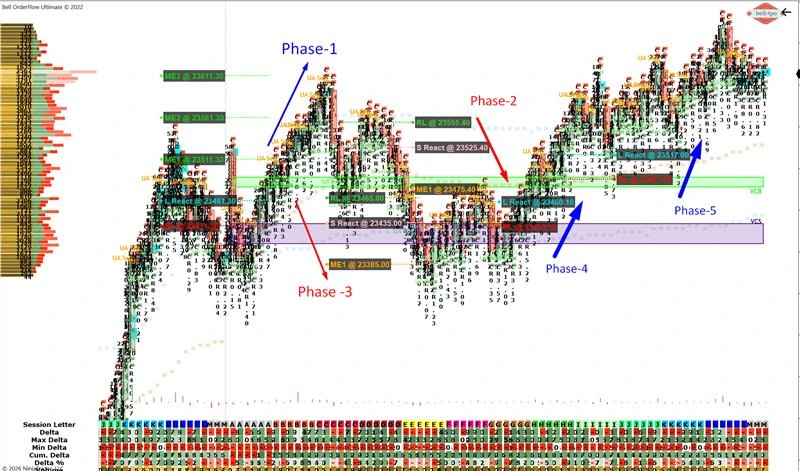
This case study highlights a multi-phase structured move in NIFTY_I, where a total of 190 points was observed using a combination of VC, TBTS, CR, and UA signals. Each phase demonstrates how price interacted with Market Equilibrium (ME), Reaction levels, and Risk Limits (RL), offering a clear framework to understand market behavior.
Maximize Your Trading Edge with Bell Orderflow Ultimate Visit www.belltpo.com or reach out to us for more details.
Phase 1: 150 Points Short Move (VC + TBTS + CR)
ME-3, ME-2, ME-1 (23611.30 → 23511.30)
- The sequence of Market Equilibrium levels acted as a step-by-step continuation structure. Price consistently moved from one equilibrium to the next, indicating sustained directional control.
- These ME levels served as reference zones where price paused briefly before continuing its move. The alignment of multiple ME levels reinforced the strength of the ongoing trend.
L React (Long Price Reaction @ 23461.30)
- The price reaction at this level indicated an attempt to stabilize after an extended move. It showed temporary absorption, but lacked the strength to shift the overall structure.
- This reaction level acted as a minor counter response within the broader move. It provided insight into how the market was responding to lower price zones.
RL (Risk Limit @ 23431.30)
- Risk Limit defined the terminal boundary for this phase, marking the extreme of the move. It helped identify where the structure could potentially pause or reverse.
- The presence of RL ensured clarity in understanding the completion of the move. It acted as a protective reference for maintaining discipline in volatile conditions.
Phase 2: 50 Points Long Move (TBTS + CR)
ME-1 (Market Equilibrium @ 23475.40)
- Market Equilibrium acted as a central pivot where price rotated during this phase. It highlighted a temporary balance after the prior directional move.
- This level provided a reference for price acceptance and movement within a defined range. It helped track how the market transitioned into a new phase.
S React (Short Price Reaction @ 23525.40)
- The reaction at this level showed resistance to upward movement. It reflected the presence of opposing pressure as price approached higher zones.
- This reaction level helped identify where momentum started to slow down. It provided a clear indication of how the market was responding to upward attempts.
RL (Risk Limit @ 23555.40)
- Risk Limit marked the upper boundary for this phase, defining the limit of price extension. It ensured that the structure remained well-defined.
- This level acted as a safeguard, indicating where the phase could lose its strength. It reinforced disciplined tracking of market structure.
Phase 3: 50 Points Short Move (VC + CR + UA)
ME-1 (Market Equilibrium @ 23385.00)
- Market Equilibrium served as the destination where price gravitated during this move. It indicated a return to balance after directional movement.
- This level provided a logical completion zone for the phase. It highlighted how price seeks equilibrium after periods of imbalance.
S React (Short Price Reaction @ 23435.00)
- The short reaction confirmed renewed pressure as price responded sharply at this level. It aligned with the continuation of the broader structure.
- This reaction level reflected active participation and momentum in the move. It helped validate the directional intent of this phase.
RL (Risk Limit @ 23465.00)
- Risk Limit defined the upper threshold, ensuring clarity in structure. It marked the point beyond which the phase would lose its validity.
- This level acted as a control point for managing volatility. It reinforced the importance of predefined boundaries.
Phase 4: 30 Points Risk Limit Hit
L React (Long Price Reaction @ 23460.10)
- The price reaction showed an attempt to move upward from this level. It indicated localized strength within a constrained structure.
- However, the reaction lacked continuation, highlighting limited follow-through. It reflected a short-lived response in the market.
RL (Risk Limit @ 23430.10)
- Risk Limit was triggered, marking the failure of the structure. It indicated that the expected move did not sustain.
- This level reinforced the importance of disciplined boundaries. It helped identify when the structure was no longer valid.
Phase 5: 30 Points Risk Limit Hit
L React (Long Price Reaction @ 23517.00)
- The reaction level indicated another attempt at upward movement. It showed initial strength but lacked sustained momentum.
- This highlighted how reactions alone are not sufficient without confirmation. It emphasized the importance of structure alignment.
RL (Risk Limit @ 23487.00)
- Risk Limit was hit again, signaling invalidation of the setup. It clearly marked the breakdown of the expected structure.
- This level served as a reminder of disciplined risk control. It ensured that deviations from structure are identified early.
Key Learning
- Multiple ME levels in sequence indicate strong structured movement.
- Reaction levels provide insight into how price responds within each phase.
- Risk Limits are critical for defining boundaries and maintaining discipline.
- Not all phases lead to continuation — recognizing invalidations is equally important.
Maximize Your Trading Edge with Bell Orderflow Ultimate Visit www.belltpo.com or reach out to us for more details.