Educational Takeaway: Net 70 Points Move Captured in NIFTY_I with VC + TBTS + MR Alert + TR Alert + UA + CR using Bell Orderflow Ultimate
The recent session in NIFTY_I demonstrated a well-structured 70-point directional move identified using a confluence of VC + TBTS + MR Alert + TR Alert + UA + CR within the Bell Orderflow Ultimate framework.
This article is purely for educational purposes and explains how predefined Risk Limits (RL), Price Reactions, and Market Equilibrium (ME) levels help in maintaining structured market analysis.
Maximize Your Trading Edge with Bell Orderflow Ultimate Visit www.belltpo.com or reach out to us for more details.
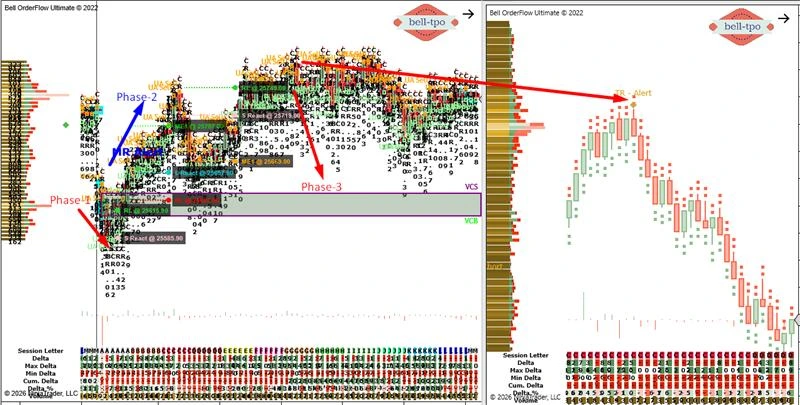
Phase-1: 30-Point Risk Threshold Activated
RL (Risk Limit @ 25615.90)
- The Risk Limit marked the predefined structural invalidation boundary.
- Once price interacted with this level, it confirmed that the projected scenario required reassessment.
S React (Short Price Reaction @ 25585.90)
- The price reaction zone reflected active participation and momentum response.
- It helped validate short-term directional strength within defined parameters.
Understanding the Core Levels
ME Levels (Market Equilibrium)
- ME represents a fair value zone where buying and selling activity temporarily balance.
- Price often gravitates toward ME during rotational or balancing phases.
Price Reaction
- Reaction levels indicate where responsive participants engage with conviction.
- They help assess whether continuation or rotation is unfolding.
Risk Limit (RL)
- Risk Limit defines the structural boundary of a setup.
- It ensures disciplined exposure management based on predefined rules.
Phase-2: 50-Point Continuation Move
Important Observation: The MR alert was considered invalid as the low of the MR candle was not breached. As a result, continuation strength persisted toward equilibrium.ME-1 (Market Equilibrium @ 25707.00)
- Price gravitated toward ME-1 as continuation pressure remained intact.
- This level acted as a natural balancing magnet before the next rotation.
L React (Long Price Reaction @ 25657.00)
- The reaction zone supported upward continuation within structured orderflow conditions.
- Participation strength was sustained without structural breakdown.
RL (Risk Limit @ 25627.00)
- This Risk Limit maintained exposure control during continuation.
- Holding above this level preserved structural strength in the move.
Phase-3: 50-Point Rotational Adjustment
RL (Risk Limit @ 25749.00)
- This Risk Limit marked the exhaustion boundary of the prior expansion.
- Failure to sustain beyond it indicated structural rotation.
S React (Short Price Reaction @ 25719.00)
- The reaction level signaled responsive activity from the opposite side.
- Momentum shifted as earlier inventory began adjusting.
ME-1 (Market Equilibrium @ 25669.00)
- Price rotated back toward equilibrium after reaching expansion extremes.
- ME once again functioned as a fair value anchor.
Key Educational Insights
- Alerts must be validated through structural confirmation.
- Equilibrium levels often act as magnets during balancing phases.
- Risk Limits help maintain disciplined exposure management.
- Multi-factor confluence improves analytical clarity.
Maximize Your Trading Edge with Bell Orderflow Ultimate Visit www.belltpo.com or reach out to us for more details.