Educational Takeaway: Net 625 Points Move Captured in NIFTY_I with VC + TBTS + CR + UA using Bell Orderflow Ultimate
NIFTY_I delivered a high-momentum, directional session where Bell Orderflow Ultimate clearly highlighted market intent using a confluence of VC, TBTS, CR, and UA. The session unfolded in two distinct phases, offering a structured view of how institutional activity guided price discovery.
This breakdown is strictly educational, focusing on market behavior, reactions, and equilibrium shifts.
Phase-1: Extended Directional Expansion (650 Points)
Market Context
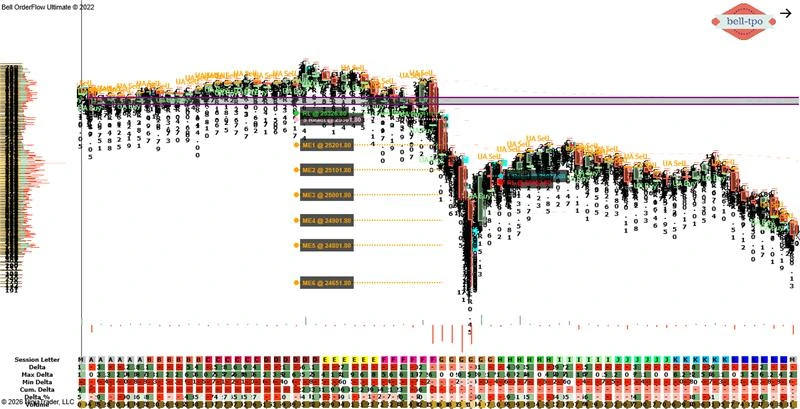
- Phase-1 was driven by Volume Cluster alignment (VC), Trapped Participation (TBTS), COT Ratio confirmation (CR), and the presence of an Unfinished Auction (UA).
- These conditions together signaled strong directional conviction and continuation through multiple equilibria.
Market Equilibrium (ME Levels)
- ME-1 to ME-6 acted as progressive balance zones, showing how price accepted lower value areas one after another.
- Each ME transition confirmed that value was migrating rather than rotating, validating sustained participation.
Price Reaction
- Short Price Reaction was observed near 25301.80, confirming responsiveness at the upper reference zone.
- Subsequent reactions respected each ME level, reinforcing structured movement rather than random volatility.
Risk Limit
- The Risk Limit at 25328.80 defined the invalidation boundary for Phase-1 structure.
- Price remaining below this level maintained structural integrity throughout the expansion.
Phase-2: Structural Pause & Risk Interaction (25 Points)
Market Context
- Phase-2 marked a shift from expansion to response-based behavior, where prior momentum encountered opposing inventory.
- This phase highlighted how markets react when extension meets predefined risk boundaries.
Market Equilibrium (ME Levels)
- ME activity condensed, indicating temporary balance rather than further value migration.
- This compression reflected a pause in directional conviction after the larger move.
Price Reaction
- A Long Price Reaction emerged near 25077.30, showing responsive behavior at a prior reference.
- This reaction confirmed that short-term participants were active near the equilibrium zone.
Risk Limit
- The Risk Limit at 25052.30 was tested and subsequently respected.
- Interaction with this level signaled completion of the secondary phase without structural continuation.
Key Learning Points
- Multi-ME progression reflects acceptance, not randomness.
- UA zones often act as magnets during strong directional sessions.
- Risk Limits are critical for structure validation, not just protection.
- Price reactions at ME levels reveal participant strength and responsiveness.
Indicator Glossary
- VC – Cluster Zone
- UA – Unfinished Auction
- TBTS – Trapped activity
- CR – COT Ratio
Conclusion
The session illustrated how Bell Orderflow Ultimate efficiently aligns market structure with volume confirmation through TBTS and UA alerts. By adhering to predefined risk limits and reaction zones, traders can observe disciplined execution and avoid impulsive decision-making.
This approach highlights the importance of structure-based trading — focusing on context and orderflow validation, rather than prediction. Such analysis helps traders understand intraday behavior, manage exposure effectively, and enhance consistency within a rules-based framework.
Maximize Your Trading Edge with Bell Orderflow Ultimate
Visit www.belltpo.com or reach out to us for more details.
Disclaimer
We are a software and indicator development company. This chart and analysis are for educational and informational purposes only. This is not investment advice or a recommendation to buy, sell, or trade any financial instrument. Users must conduct their own research before making any trading decisions. Past performance is not indicative of future results.