Educational Takeaway: Net 60 Points Move Captured in NIFTY_I with VC + TBTS + CR using Bell Orderflow Ultimate
Markets often progress through multiple structured phases where price interacts with key reference levels before expanding into a stronger directional move. Using Bell Orderflow Ultimate, traders can observe how Price Reactions, Risk Limits, and Market Equilibrium levels reveal the underlying orderflow behavior of the market.
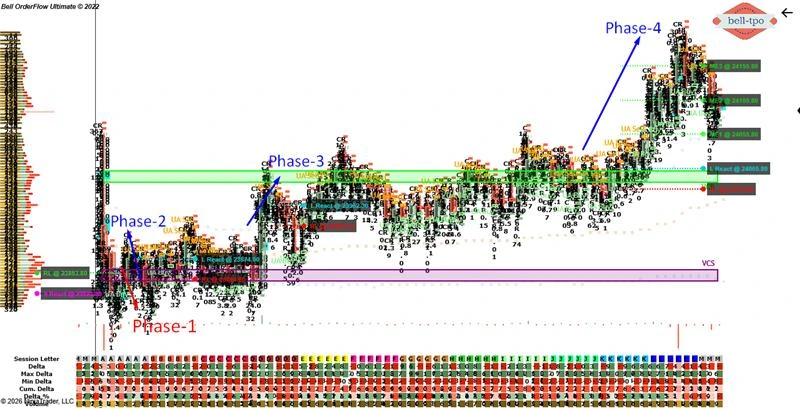
In this session, NIFTY_I delivered a net 60-point opportunity, where the market first moved through several Risk Limit interactions before transitioning into a stronger expansion driven by VC and CR.
Maximize Your Trading Edge with Bell Orderflow Ultimate Visit www.belltpo.com or reach out to us for more details.
Phase-1: Initial Risk Limit Interaction (30 Points Range)
RL (Risk Limit @ 23853.80)
- Risk Limit represents the structural boundary where the current market condition is tested. It defines the tolerance level beyond which the existing structure may lose its validity.
- Observing how price behaves near this level helps traders understand whether the market structure is maintaining strength or preparing for a transition.
S React (Short Price Reaction @ 23828.80)
- Short Price Reaction levels indicate zones where supply begins to respond within the orderflow. These reactions highlight areas where upward movement encounters responsive pressure.
- Such reactions often mark the beginning of a rotational phase within the market.
Phase-2: Secondary Risk Limit Interaction (30 Points Range)
L React (Long Price Reaction @ 23874.00)
- Long Price Reaction zones represent areas where demand begins to respond to price movement. These levels indicate where the market starts showing strength after testing lower areas.
- They often act as early signs that the market is attempting to stabilize within the current structure.
RL (Risk Limit @ 23844.00)
- Risk Limit continues to act as the structural safeguard for the developing setup. It clearly identifies the level beyond which the current structure would be considered invalid.
- Monitoring this boundary helps maintain clarity during periods of short-term volatility.
Phase-3: Continued Structure Development (30 Points Range)
L React (Long Price Reaction @ 23952.30)
- Another long price reaction occurred at a higher level, showing that the market continued to respond positively to upward movement. This indicates a shift in participation as the market transitions through different value areas.
- Such reactions often reflect the strengthening of the current structure.
RL (Risk Limit @ 23927.30)
- Risk Limit once again defines the protective boundary of the setup. It serves as the reference level that determines whether the ongoing structure remains intact.
- This helps traders maintain disciplined observation of market behavior.
Phase-4: Expansion Phase with VC + CR (150 Points Move)
ME-3 (Market Equilibrium @ 24155.80)
- Higher Market Equilibrium levels represent areas where the market temporarily stabilizes during strong directional movement. These zones indicate acceptance of price at higher value levels.
- They often act as checkpoints where the market reassesses balance before continuing the move.
ME-2 (Market Equilibrium @ 24105.80)
- Mid-level equilibrium zones help track the progression of value migration during the expansion phase. These levels often serve as reference areas where price consolidates briefly.
- Such levels provide insight into how the market maintains structure during directional movement.
ME-1 (Market Equilibrium @ 24055.80)
- The initial equilibrium level marks the early stage of value acceptance during the expansion. It represents the first area where the market temporarily balances before continuing higher.
- This level often acts as the base reference for the broader move.
L React (Long Price Reaction @ 24005.80)
- This price reaction level highlights where demand strongly responded within the orderflow. It marks the zone where the expansion phase gained momentum.
- Such reactions often serve as the structural foundation for larger price movements.
RL (Risk Limit @ 23975.80)
- Risk Limit defines the structural boundary protecting the expansion setup. As long as price remains above this level, the overall structure continues to remain valid.
- This level helps maintain risk discipline while observing strong market movements.
Conclusion
This session demonstrates how markets often progress through multiple Risk Limit interactions and price reactions before transitioning into a stronger expansion phase. By observing Risk Limits, Price Reactions, and Market Equilibrium levels, traders can gain deeper insights into how the market transitions from initial structure development to directional movement. Bell Orderflow Ultimate helps visualize these critical orderflow levels clearly, enabling traders to interpret market behavior using objective structural references.Maximize Your Trading Edge with Bell Orderflow Ultimate Visit www.belltpo.com or reach out to us for more details.