Educational Takeaway: Net 60 Points Move Captured in NIFTY_I with VC + MR + TBTS + CR + UA using Bell Orderflow Ultimate
Understanding intraday structure through Orderflow is not about predicting direction — it’s about reading behavior, managing risk, and responding to evolving market conditions.
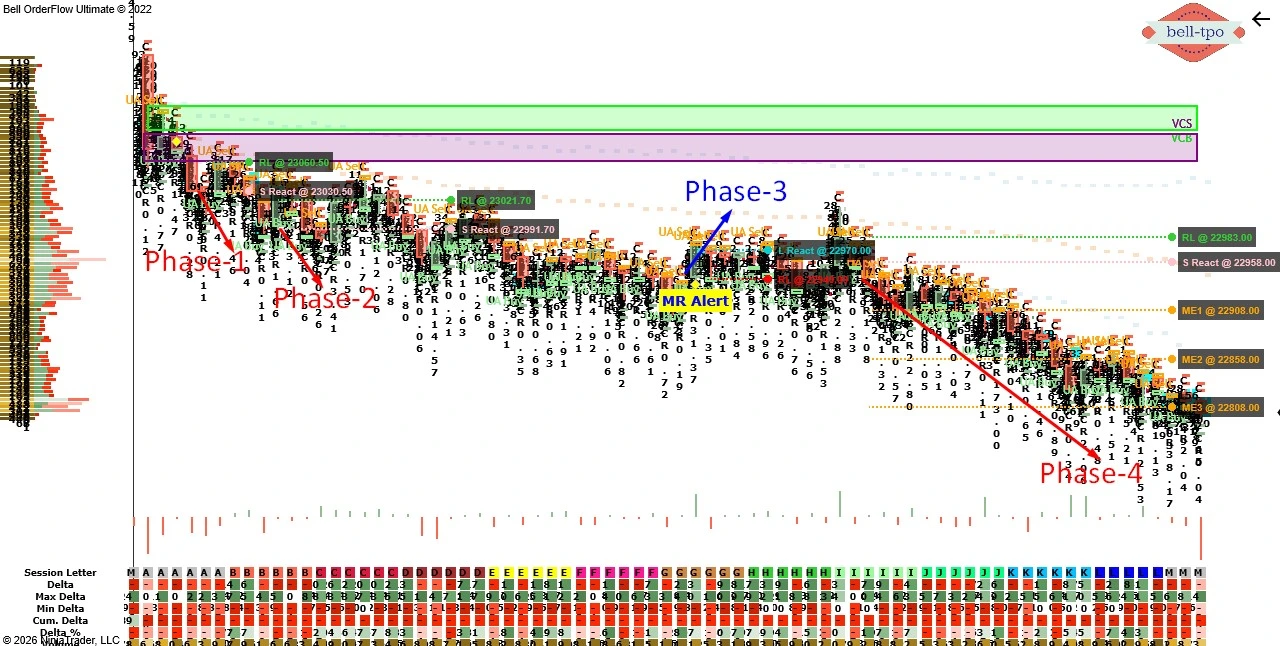
In this case study, we break down how multiple phases unfolded using VC + MR + TBTS + CR + UA, leading to a structured 60-point opportunity in NIFTY_I.
Maximize Your Trading Edge with Bell Orderflow Ultimate Visit www.belltpo.com or reach out to us for more details.
Phase 1: Initial Risk Engagement (30 Points)
Risk Limit (RL @ 23060.50)
- The market approached a predefined risk boundary, signaling a zone where volatility could expand.
- This level acts as a reference point to define invalidation and control exposure.
Price Reaction (S React @ 23030.50)
- Price showed a reaction after testing the higher level, indicating responsive activity from participants.
- Such reactions help identify whether the market is accepting or rejecting value.
Market Equilibrium (ME Levels)
- No significant equilibrium levels were formed in this phase.
- This indicates the market was still in a discovery mode without balance.
Phase 2: Continued Downside Pressure (30 Points)
Risk Limit (RL @ 23021.70)
- A new risk boundary formed lower, adjusting the reference for ongoing market movement.
- This shift reflects how risk dynamically trails price behavior.
Price Reaction (S React @ 22991.70)
- Another reaction confirmed continuation of pressure from higher levels.
- Repeated reactions at lower zones indicate sustained directional intent.
Market Equilibrium (ME Levels)
- The absence of equilibrium suggests imbalance dominance.
- The market continues to seek value rather than settle.
Phase 3: Structural Transition (30 Points)
Risk Limit (RL @ 22940.00)
- Risk shifted further down, marking a critical structural level.
- This zone becomes important for assessing potential exhaustion or continuation.
Price Reaction (L React @ 22970.00)
- A shift in reaction type indicated a change in participant behavior.
- This is often an early sign of possible transition in market control.
Market Equilibrium (ME Levels)
- Still no clear equilibrium formation, suggesting incomplete balance.
- The market remains in transition between imbalance phases.
Phase 4: Expansion Phase (150 Points Move)
Risk Limit (RL @ 22983.00)
- A fresh risk boundary was established before expansion.
- This level helped define the structure before momentum entered the market.
Price Reaction (S React @ 22958.00)
- Initial reaction provided confirmation of participation at key levels.
- Reactions near expansion zones often precede strong directional moves.
Market Equilibrium (ME Levels)
- ME-1 (22908.00): First level where price found temporary balance during expansion.
- ME-2 (22858.00): Reinforced the continuation of structured movement.
- ME-3 (22808.00): Highlighted sustained momentum with controlled progression.
Key Learning
- Markets move in phases, not straight lines.
- Risk Limits define structure, not just stop points.
- Price Reactions reveal participation, not direction alone.
- Market Equilibrium levels show where value is accepted during movement.
Maximize Your Trading Edge with Bell Orderflow Ultimate Visit www.belltpo.com or reach out to us for more details.