Educational Takeaway: Net 50 Points Move captured in NIFTY_I with VC Zone + TBTS + UA + CR using Bell Orderflow Ultimate
A net 50-point move was captured in today’s NIFTY_I session using a powerful confluence of VC Zone (Volume Cluster), TBTS (Trapped Buyers/Sellers), Unfinished Auction (UA), and COT Ratio (CR) within Bell Orderflow Ultimate. The session showcased a precise orderflow reaction from the VC boundary, delivering a short directional move with controlled risk and clean execution.
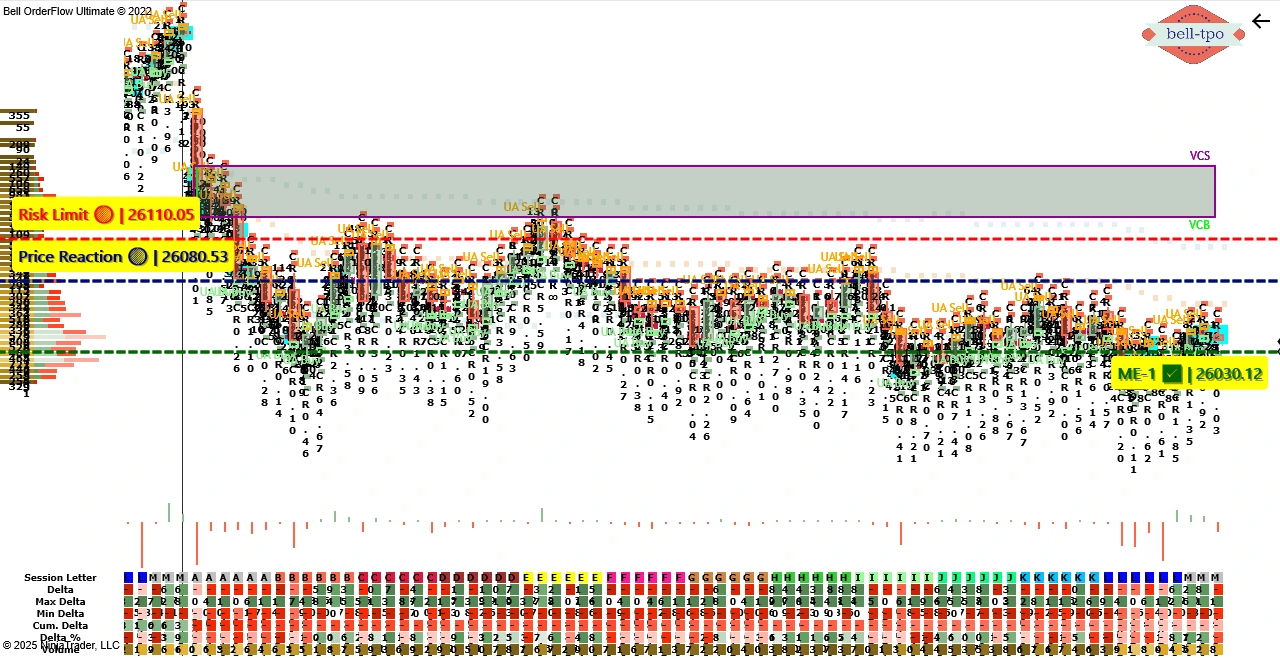
Phase-1: Down Move (50 Points Captured)
Price Reaction @26080.53:
The first sign of selling strength appeared at this price reaction level, indicating a clear rejection near the upper VC boundary. Price reaction highlighted exhaustion of buyers, leading to a short bias confirmation in alignment with TBTS and UA signals.
Risk Limit @26110.05:
The protective risk cap was placed just above the reaction zone to secure against false breakouts. A disciplined stop placement ensured the trade maintained a tight reward-to-risk profile with minimal drawdown exposure.
ME-1 @26030.12:
The Market Equilibrium (ME) level acted as a precise intraday target derived from orderflow balance and absorption structure. This ME level marked the ideal exit zone as price completed its equilibrium move after the reaction phase.
Conclusion
The session illustrated how Bell Orderflow Ultimate efficiently aligns market structure with volume confirmation through VC, TBTS, and UA alerts. By adhering to predefined risk limits and reaction zones, traders can observe disciplined execution and avoid impulsive decision-making.
This approach highlights the importance of structure-based trading — focusing on context and orderflow validation, rather than prediction. Such analysis helps traders understand intraday behavior, manage exposure effectively, and enhance consistency within a rules-based framework.
Maximize Your Trading Edge with Bell Orderflow Ultimate
Visit www.belltpo.com or reach out to us for more details.
Disclaimer
We are a software and indicator development company. This chart and analysis are for educational and informational purposes only. This is not investment advice or a recommendation to buy, sell, or trade any financial instrument. Users must conduct their own research before making any trading decisions. Past performance is not indicative of future results.