Educational Takeaway: Net 450 Points Move Captured in NIFTY_I with VC + TBTS + MR + CR using Bell Orderflow Ultimate
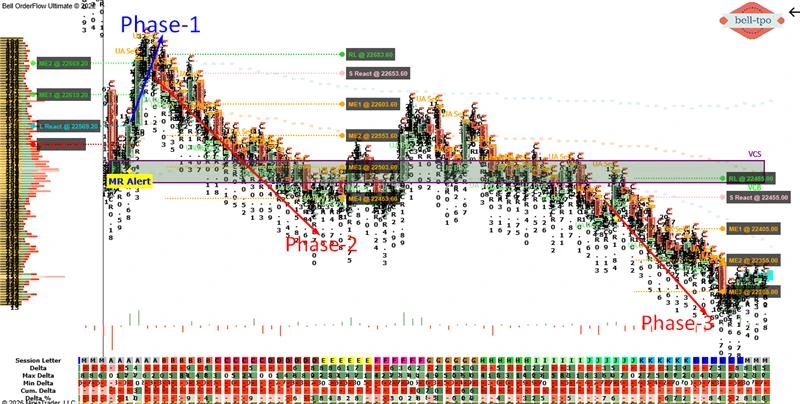
This case study highlights a powerful 450-point structured move in NIFTY_I, driven by a confluence of VC, TBTS, MR, and CR signals. Across four distinct phases, price consistently respected Market Equilibrium (ME), Reaction levels, and Risk Limits (RL), demonstrating a disciplined and repeatable framework.
Maximize Your Trading Edge with Bell Orderflow Ultimate Visit www.belltpo.com or reach out to us for more details.
Phase 1: 100 Points Long Move (VC + MR + CR)
ME-2 & ME-1 (22669.20 → 22619.20)
- Market Equilibrium levels acted as structured checkpoints guiding the movement. Price transitioned smoothly across these zones, indicating controlled progression.
- These ME levels provided areas of temporary balance before continuation. Their alignment reflected a well-organized and stable phase.
L React (Long Price Reaction @ 22569.20)
- The long price reaction showed strong responsiveness from lower levels. It indicated active participation supporting the phase.
- This reaction level acted as a foundation for the move. It highlighted where momentum began to build within the structure.
RL (Risk Limit @ 22539.20)
- Risk Limit defined the lower boundary, ensuring clarity in structure. It marked the point beyond which the phase would weaken.
- This level reinforced disciplined tracking of price behavior. It served as a safeguard for maintaining structural validity.
Phase 2: 200 Points Short Move (TBTS + CR)
ME-1 to ME-4 (22603.60 → 22453.60)
- A strong sequence of Market Equilibrium levels formed a clear continuation structure. Price moved systematically across these zones, indicating sustained control.
- These ME levels acted as stepping stones, guiding the movement with clarity. Their alignment confirmed a high-confidence phase.
S React (Short Price Reaction @ 22653.60)
- The short price reaction confirmed strong responsiveness at higher levels. It aligned with the continuation of the broader structure.
- This reaction level acted as a trigger for momentum. It reflected active participation within the phase.
RL (Risk Limit @ 22683.60)
- Risk Limit defined the upper boundary, ensuring the structure remained controlled. It marked the threshold where the phase would lose strength.
- This level reinforced disciplined execution. It helped maintain clarity in identifying structural limits.
Phase 3: 150 Points Move (VC + CR)
ME-1 to ME-3 (22405.00 → 22305.00)
- A sequence of Market Equilibrium levels provided a structured continuation path. Price moved efficiently across these zones, reflecting strong control.
- These ME levels acted as reference checkpoints for tracking movement. Their alignment confirmed a well-defined phase.
S React (Short Price Reaction @ 22455.00)
- The short price reaction showed clear responsiveness at higher levels. It aligned with the continuation of the structure.
- This reaction level highlighted active participation. It served as confirmation of momentum within the phase.
RL (Risk Limit @ 22485.00)
- Risk Limit defined the upper boundary, ensuring the structure remained intact. It marked the threshold beyond which the phase would weaken.
- This level reinforced disciplined execution. It helped maintain clarity in identifying structural boundaries.
Key Learning
- Sequential ME levels act as a roadmap for structured price movement.
- Reaction levels highlight where momentum and participation emerge.
- Risk Limits are essential for defining boundaries and managing invalidation.
- Strong confluence of signals ensures clarity, structure, and confidence across phases.
Maximize Your Trading Edge with Bell Orderflow Ultimate Visit www.belltpo.com or reach out to us for more details.