Educational Takeaway: Net 300 Points Captured in Dow Jones Using Bell Orderflow Ultimate with VC Zone + TBTS + UA + CR
An impressive 300-point upside move was captured in Dow Jones using a confluence of VC Zone, TBTS, UA, and CR setups within Bell Orderflow Ultimate. This sequence reflects a textbook example of precise execution powered by advanced orderflow confirmation and controlled risk management.
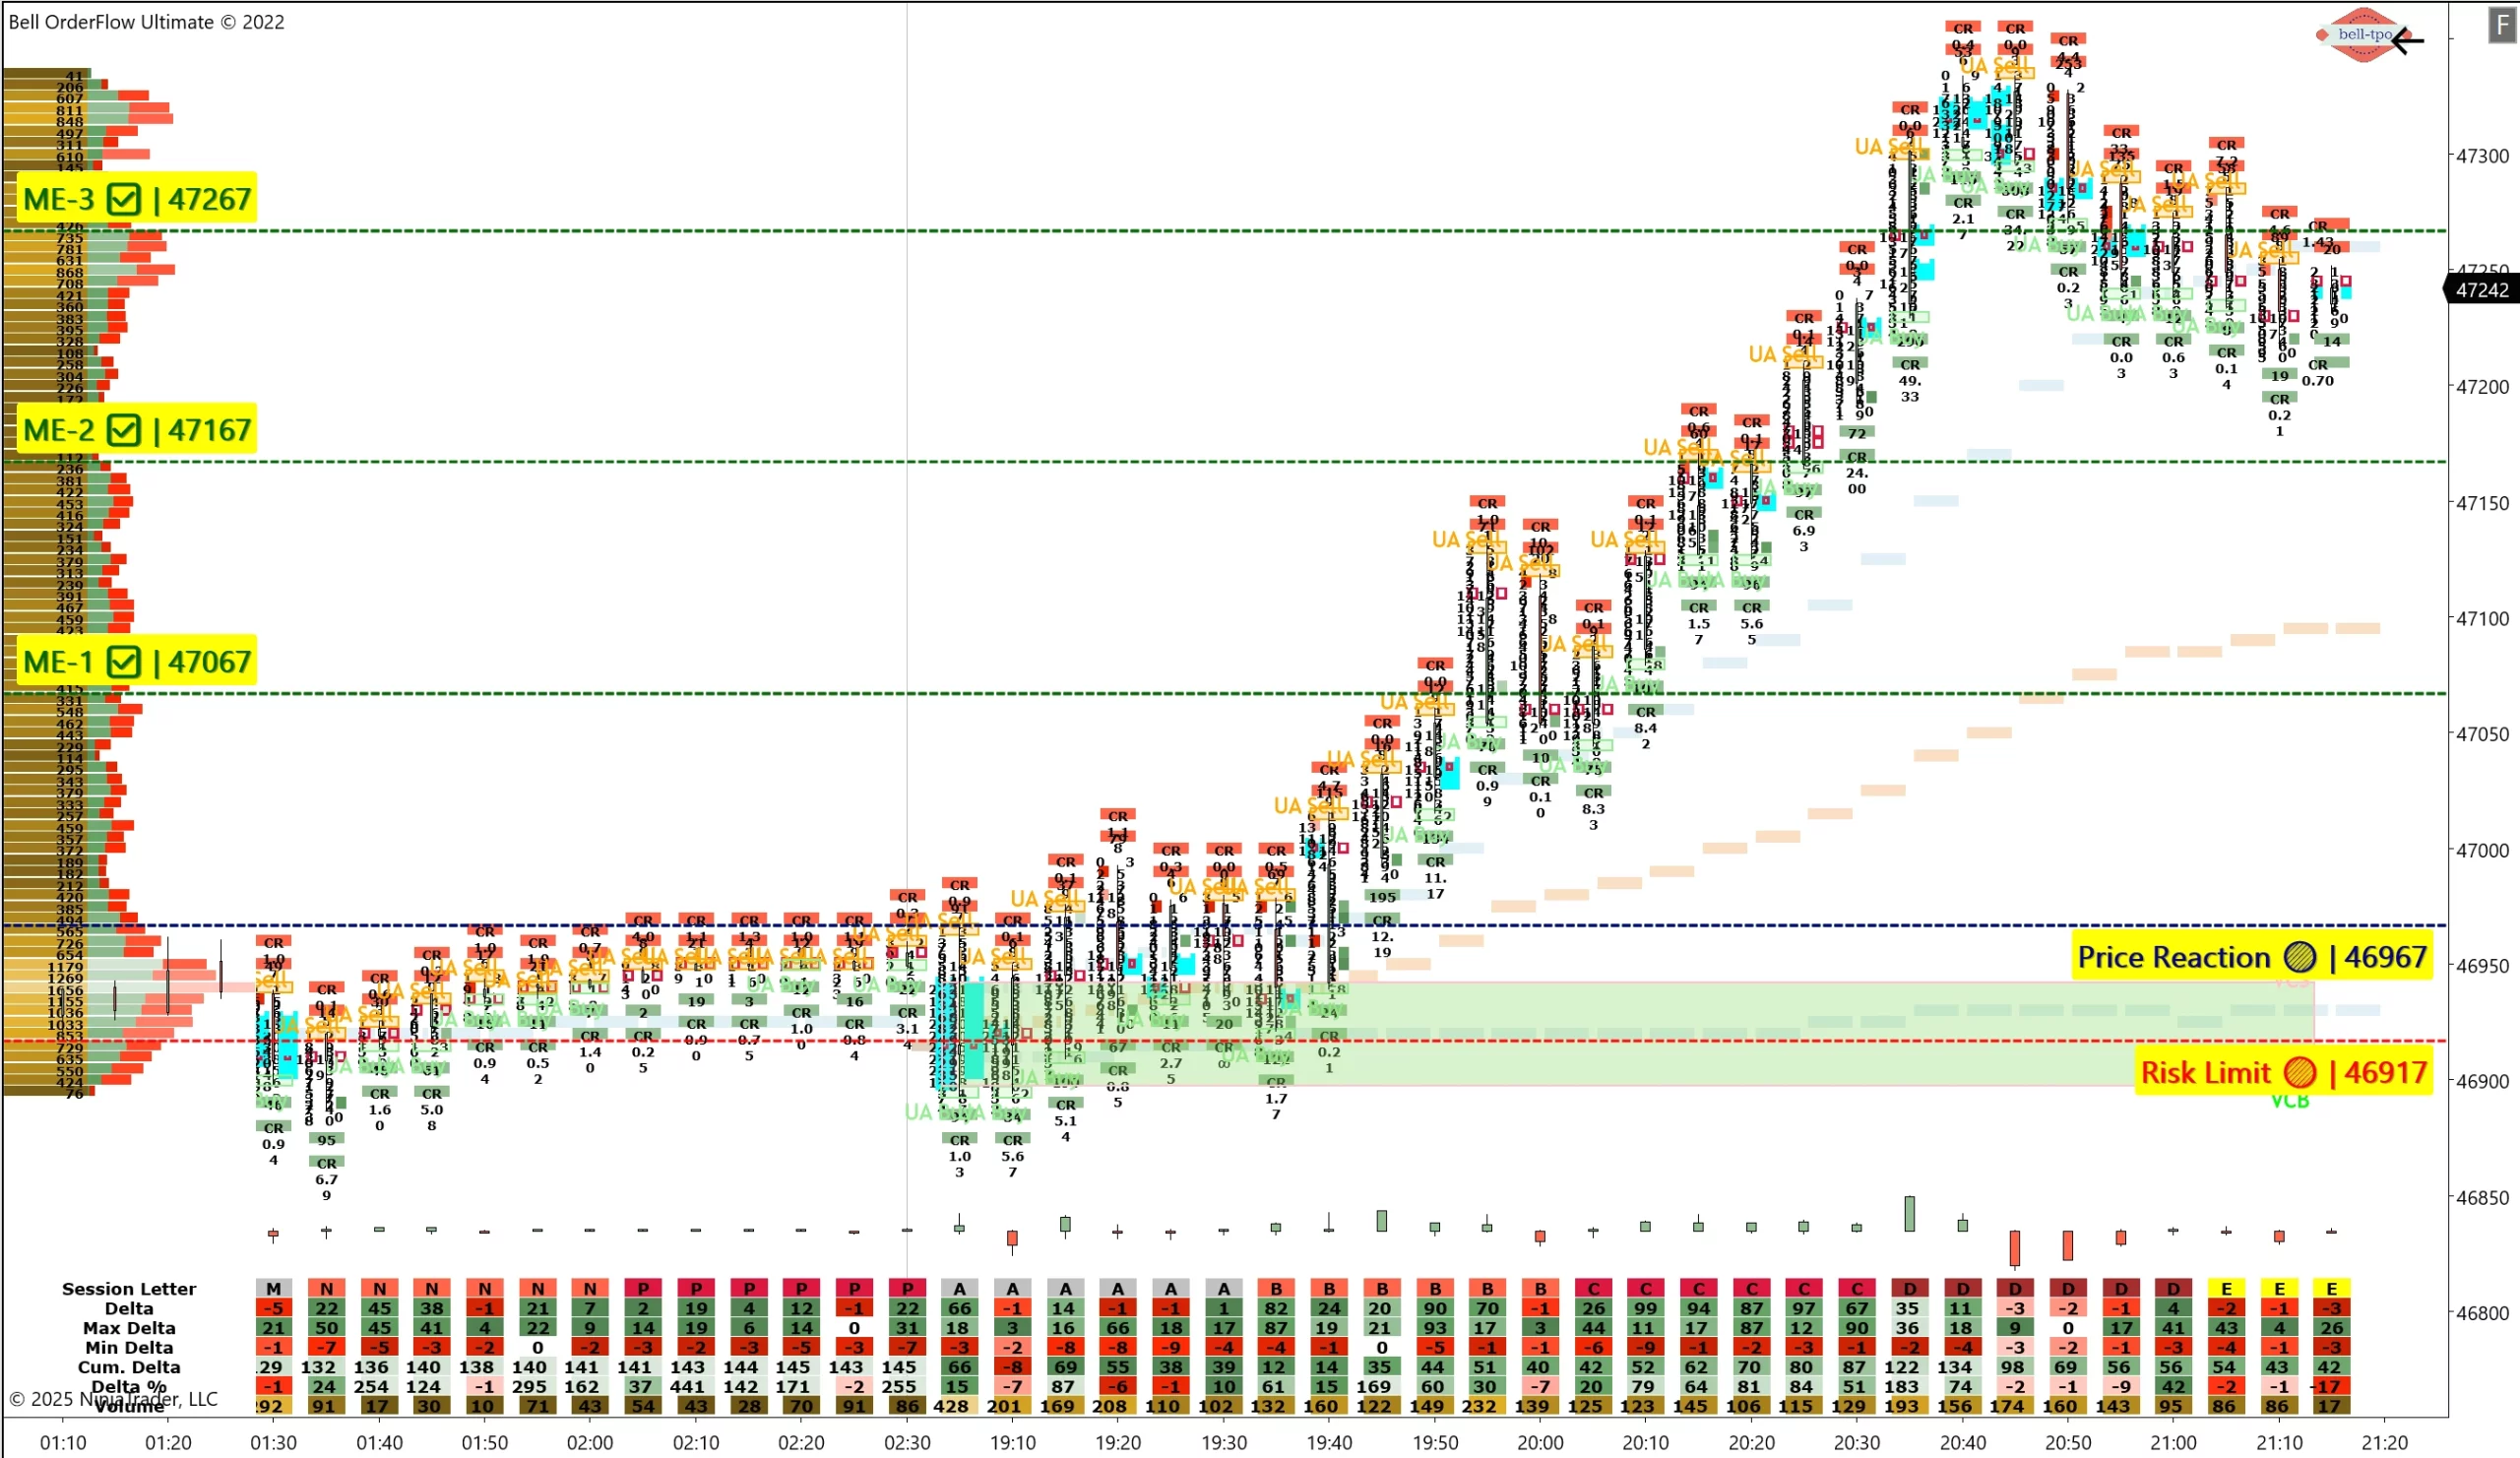
Price Reaction @46967
A strong price reaction was observed around 46967, confirming the initial absorption and transition phase from balance to initiative buying. This reaction zone became the springboard for the upside momentum, establishing early control by responsive buyers.
Risk Limit @46917
Defined risk was clearly mapped at 46917, providing a tight 50-point buffer below the reaction zone. The limited downside exposure ensured controlled trade management while maintaining favorable reward potential.
ME-1 @47067
The first measured extension (ME-1) printed at 47067, validating the initial breakout strength. The move from the reaction point to ME-1 confirmed continued buying interest with sustained delta support.
ME-2 @47167
As price advanced to ME-2, momentum confirmed a healthy continuation of the trend. Orderflow clusters indicated efficient participation, with no sign of exhaustion — a strong sign of trend persistence.
ME-3 @47267
The final measured extension (ME-3) target was achieved at 47267, marking a total gain of 300 points from the entry zone. This level witnessed responsive profit-taking, signaling the completion of the planned trade structure.
Summary
This session illustrates how combining VC Zone + TBTS + UA + CR within Bell Orderflow Ultimate can deliver structured and high-probability setups. Each phase — from price reaction to measured extensions — validated the precision and reliability of BellTPO multi-layered orderflow framework.
✅ Maximize Your Trading Edge with Bell Orderflow Ultimate
Visit www.belltpo.com or reach out to us for more details.
🚨 Disclaimer:
We are a software and indicator development company. This chart and analysis are for educational and informational purposes only. This is not investment advice or a recommendation to buy, sell, or trade any financial instrument. Users must conduct their own research before making any trading decisions. Past performance is not indicative of future results.