Educational Takeaway: Net 270 Points Move Captured in NIFTY_I with VC + MR Alert + TBTS + CR + UA using Bell Orderflow Ultimate
This session highlights how structured orderflow concepts helped interpret multiple directional expansions and pauses across the day. The focus remains purely on market behavior, participation imbalance, and risk reference management using Bell Orderflow Ultimate.
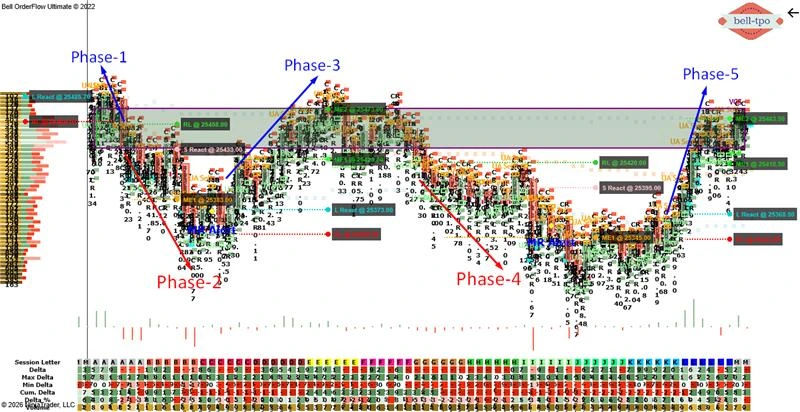
Phase-1: Initial Balance Interaction (25 Points Risk Reference)
Concepts Applied: VC + TBTS + UA + CR
Price Reaction
- The Long Price Reaction near 25485.70 reflected responsive participation emerging from a clustered zone.
- This reaction indicated short-term acceptance after early imbalance resolution.
Risk Limit
- The Risk Limit at 25460.70 defined the maximum tolerated adverse excursion for this phase.
- It acted as a structural boundary to assess whether acceptance or rejection was developing.
Market Equilibrium
- This phase focused more on testing responsiveness rather than equilibrium development.
- The absence of ME here indicated a probing move rather than balance formation.
Phase-2: Directional Extension with Balance Test (50 Points)
Concepts Applied: VC + TBTS + CR
Price Reaction
- The Short Price Reaction at 25433.00 showed initiative participation after failure to sustain higher levels.
- This reaction confirmed directional intent away from the prior cluster.
Risk Limit
- The Risk Limit at 25458.00 acted as a reference for invalidation of the downside extension.
- Holding below this level maintained structural clarity for continuation.
Market Equilibrium
- ME-1 at 25383.00 marked the first area of balance where participation stabilized.
- This level acted as a pause point before the next directional decision.
Phase-3: Momentum Expansion and Acceptance (100 Points)
Concepts Applied: MR + TBTS + CR
Price Reaction
- The Long Price Reaction near 25373.00 highlighted responsive activity after momentum exhaustion.
- This reaction aligned with trapped participation getting resolved.
Risk Limit
- The Risk Limit at 25348.00 defined the lower boundary of acceptance for this phase.
- Sustaining above it confirmed continuation of structural strength.
Market Equilibrium
- ME-1 at 25423.00 and ME-2 at 25473.00 showed progressive acceptance at higher levels.
- This migration reflected strengthening participation and expanding value.
Phase-4: Counter-Move and Rebalancing (50 Points)
Concepts Applied: VC + CR + UA
Price Reaction
- The Short Price Reaction at 25395.00 indicated responsive activity from a previously accepted zone.
- This reaction suggested temporary inventory adjustment rather than trend reversal.
Risk Limit
- The Risk Limit at 25420.00 defined the upper tolerance for this corrective move.
- Failure to reclaim this level maintained the integrity of the rebalancing structure.
Market Equilibrium
- ME-1 at 25345.00 acted as a rebalancing point where activity slowed.
- This level reflected temporary acceptance before the next directional push.
Phase-5: Final Expansion with Momentum Support (95 Points)
Concepts Applied: MR + TBTS + CR
Price Reaction
- The Long Price Reaction near 25368.50 showed strong responsive participation after momentum confirmation.
- This reaction aligned with resolution of trapped inventory.
Risk Limit
- The Risk Limit at 25343.50 provided a clear structural reference for continuation validity.
- Holding above this level supported the final expansion phase.
Market Equilibrium
- ME-1 at 25418.50 and ME-2 at 25463.50 confirmed higher value acceptance.
- This upward equilibrium migration validated sustained participation strength.
Key Educational Insights
- Cluster Zones (VC) repeatedly acted as decision points for both continuation and correction.
- Momentum Reversal (MR) alerts, when aligned with trapped participation (TBTS), helped identify expansion phases.
- Risk Limits provided consistent structural boundaries to evaluate acceptance versus failure.
- Market Equilibrium migration offered clarity on value development across the session.
Conclusion
The session illustrated how Bell Orderflow Ultimate efficiently aligns market structure with volume confirmation through TBTS and UA alerts. By adhering to predefined risk limits and reaction zones, traders can observe disciplined execution and avoid impulsive decision-making.
This approach highlights the importance of structure-based trading — focusing on context and orderflow validation, rather than prediction. Such analysis helps traders understand intraday behavior, manage exposure effectively, and enhance consistency within a rules-based framework.
Maximize Your Trading Edge with Bell Orderflow Ultimate
Visit www.belltpo.com or reach out to us for more details.
Disclaimer
We are a software and indicator development company. This chart and analysis are for educational and informational purposes only. This is not investment advice or a recommendation to buy, sell, or trade any financial instrument. Users must conduct their own research before making any trading decisions. Past performance is not indicative of future results.