Educational Takeaway: Net 2200 Point Move Captured in BTCUSD with VC + TBTS +TR + CR using Bell Orderflow Ulimtate on 10/02/2026
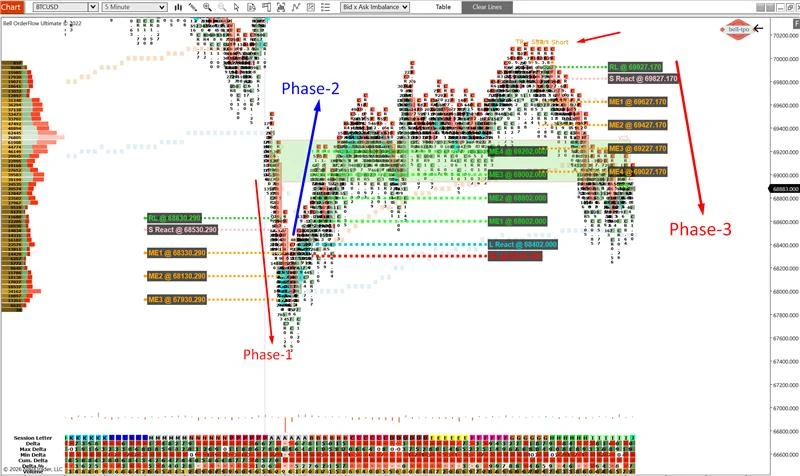
On 10th February 2026, a powerful 2200-point move unfolded in BTCUSD, structured clearly through institutional orderflow behavior. Using VC + TBTS + TR + CR inside Bell Orderflow Ultimate, the session delivered a clean multi-phase opportunity built around equilibrium rotations and structured reactions.
Phase 1: Initial Distribution & Structured Rotation
RL (Risk Limit @ 68630.290)
- Risk Limit defined the structural invalidation zone for this leg of the move.
- Price respecting this boundary confirmed controlled participation rather than random volatility.
S React (Short Price Reaction @ 68530.290)
- The Short Price Reaction indicated immediate supply response near the upper structure.
- This reaction validated the presence of trapped inventory and early imbalance confirmation.
ME-1 (Market Equilibrium @ 68330.290)
- Market Equilibrium levels act as balance points where price seeks fair value.
- ME-1 served as the first magnet level, drawing price into rotational stability.
ME-2 (Market Equilibrium @ 68130.290)
- As momentum expanded, ME-2 provided the next structured pause zone.
- Price acceptance below prior balance increased directional conviction.
ME-3 (Market Equilibrium @ 67930.290)
- This equilibrium marked deeper value exploration within the structure.
- Sustained trading around this zone confirmed institutional participation.
Phase 2: Expansion & Upside Repricing
ME-4 (Market Equilibrium @ 69202.000)
- A fresh equilibrium formed after repricing higher.
- This indicated transition from distribution to expansion.
ME-3 (Market Equilibrium @ 69002.000)
- This level acted as a rotational checkpoint during continuation.
- Holding structure around ME-3 signaled sustained momentum.
ME-2 (Market Equilibrium @ 68802.000)
- Price rebalanced briefly here before further extension.
- It served as a structured reference rather than random pullback.
ME-1 (Market Equilibrium @ 68602.000)
- This became the final defensive equilibrium during this leg.
- Maintaining structure around this zone confirmed continuation bias.
L React (Long Price Reaction @ 68402.000)
- The Long Price Reaction showed responsive demand entering the structure.
- Absorption behavior at this zone prevented deeper retracement.
RL (Risk Limit @ 68302.000)
- This Risk Limit defined the structural boundary of continuation.
- Price respecting this level confirmed controlled volatility.
Phase 3: High-Timeframe Repricing & Final Leg
RL (Risk Limit @ 69927.170)
- A new Risk Limit was established as price expanded into higher value.
- This level defined the upper structural threshold for the session.
S React (Short Price Reaction @ 69827.170)
- Short Price Reaction marked immediate supply response at elevated levels.
- This reaction helped confirm exhaustion behavior in the final stretch.
ME-1 (Market Equilibrium @ 69627.170)
- First equilibrium during the final rotation phase.
- It acted as a stabilizing magnet within expanding volatility.
ME-2 (Market Equilibrium @ 69427.170)
- Price acceptance around ME-2 confirmed balanced rotation before extension.
- This zone structured the final directional move.
ME-3 (Market Equilibrium @ 69227.170)
- Deeper rebalancing zone before renewed participation.
- It reflected institutional value reassessment.
ME-4 (Market Equilibrium @ 69027.170)
- The last equilibrium reference in this sequence.
- Price interaction here confirmed completion of the structured cycle.
Indicator Components Used
- VC (Cluster Zone) – Identified institutional volume concentration
- TR (Trend Reversal) – Highlighted directional shift
- TBTS (Trapped Buyers / Trapped Sellers) – Exposed inventory imbalance
- CR (COT Ratio) – Confirmed structural positioning bias
Key Learning
This 2200-point BTCUSD move was not random volatility — it was a structured equilibrium-to-equilibrium rotation, guided by:- Risk-defined boundaries
- Price reaction confirmations
- Institutional cluster behavior
- Systematic equilibrium migration