Educational Takeaway: Net 200 Points Move Captured in NIFTY_I with VC Zone + MR Alert + TBTS + CR + UA using Bell Orderflow Ultimate
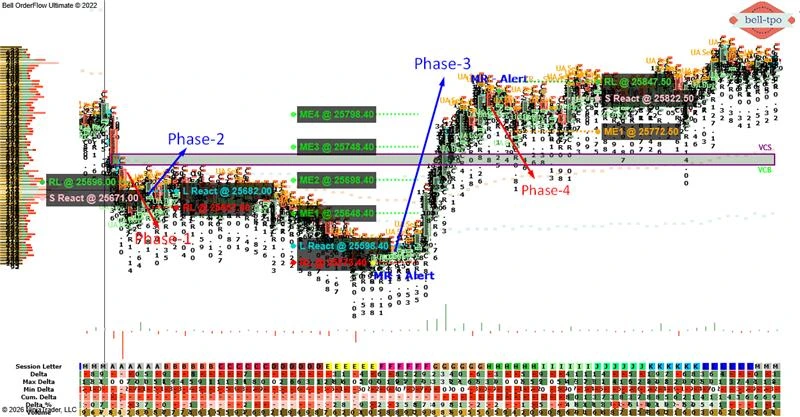
The NIFTY_I session began with two consecutive phases where a strict 25-point Price Reached Risk Limit Reference, clearly indicating early-session volatility and rotational behavior. These initial risk-limit hits helped define the broader structure for the day before the market transitioned into expansion and later rotation.
The entire move unfolded using VC Zone, MR Alert, TBTS, CR, and UA, offering a clean educational example of how orderflow references guide market behavior across different phases.
Phase-1: Initial Volatility – 25 Points Price Reached Risk Limit Reference
Risk Limit (RL)
- Phase-1 witnessed a 25-point Price Reached Risk Limit Reference at 25696, highlighting sharp early volatility and lack of directional commitment.
- The risk limit acted as a protective boundary, preventing uncontrolled price extension.
Price Reaction
- A short price reaction near 25671 indicated responsive activity emerging after the risk limit was tested.
- This reaction helped establish the first intraday reference for subsequent phases.
Phase-2: Continued Rotation – 25 Points Price Reached Risk Limit Reference
Risk Limit (RL)
- Phase-2 again saw a 25-point Price Reached Risk Limit Reference at 25657, confirming that the market remained rotational despite multiple alerts.
- Back-to-back Price Reached Risk Limit References reinforced the importance of disciplined risk containment.
Price Reaction
- A long price reaction around 25682 reflected acceptance above the prior responsive zone.
- This shift hinted at a potential transition from balance toward expansion.
Phase-3: Expansion and Value Migration
Risk Limit (RL)
- The primary expansion phase respected the risk limit at 25573.40, providing a stable base for continuation.
- Well-defined risk allowed the market to sustain a large directional move without structural breakdown.
Price Reaction
- A decisive long price reaction at 25598.40 confirmed initiative participation supported by TBTS, CR, and UA.
- The quality of reaction validated the strength of the expansion phase.
Market Equilibrium (ME) Levels
- ME-1 @ 25648.40 acted as the first pause zone during the move.
- ME-2 @ 25698.40 reflected higher value acceptance.
- ME-3 @ 25748.40 showed continued value migration with minimal overlap.
- ME-4 @ 25798.40 marked the upper equilibrium, completing the expansion structure.
- Each ME level functioned as a balance reference rather than a reversal point.
Phase-4: Late Session Rotation
Risk Limit (RL)
- In Phase-4, the risk limit at 25847.50 capped further upside exploration.
- This indicated exhaustion of initiative activity near higher value.
Price Reaction
- A short price reaction at 25822.50 signaled responsive participation from higher levels.
- The reaction resulted in controlled rotation instead of aggressive liquidation.
Market Equilibrium (ME)
- ME-1 @ 25772.50 served as the balance zone for late-session activity.
- This level highlighted temporary acceptance after expansion.
Key Educational Insight
Back-to-back 25-point Price Reached Risk Limit References in Phase-1 and Phase-2 clearly signaled a rotational environment early in the session. Once risk stabilized, the market transitioned into expansion and later balanced again, demonstrating the power of orderflow-based structure over directional bias.
Conclusion
The session illustrated how Bell Orderflow Ultimate efficiently aligns market structure with volume confirmation through TBTS and UA alerts. By adhering to predefined risk limits and reaction zones, traders can observe disciplined execution and avoid impulsive decision-making.
This approach highlights the importance of structure-based trading — focusing on context and orderflow validation, rather than prediction. Such analysis helps traders understand intraday behavior, manage exposure effectively, and enhance consistency within a rules-based framework.
Maximize Your Trading Edge with Bell Orderflow Ultimate
Visit www.belltpo.com or reach out to us for more details.
Disclaimer
We are a software and indicator development company. This chart and analysis are for educational and informational purposes only. This is not investment advice or a recommendation to buy, sell, or trade any financial instrument. Users must conduct their own research before making any trading decisions. Past performance is not indicative of future results.