Educational Takeaway: Net 200 Points Move Captured in NIFTY_I with VC + TR + UA + CR using Bell Orderflow Ultimate
Financial markets often progress through structured phases where price reacts around key orderflow levels before expanding into a larger directional move. Using Bell Orderflow Ultimate, traders can observe how Market Equilibrium levels, Price Reactions, and Risk Limits help interpret the underlying market structure.
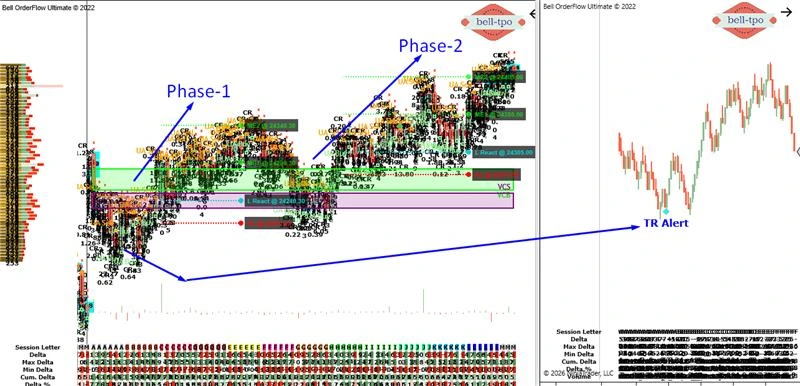
In this session, NIFTY_I delivered a net 200-point opportunity, where the move developed in two clear phases supported by VC, TR, UA, and CR concepts.
Maximize Your Trading Edge with Bell Orderflow Ultimate Visit www.belltpo.com or reach out to us for more details.
Phase-1: Expansion Phase (100 Points Move – VC + TR + UA)
ME-2 (Market Equilibrium @ 24340.30)
- Higher Market Equilibrium levels represent areas where the market temporarily accepts price during strong movement. These levels often act as checkpoints where price pauses before continuing further.
- Such equilibrium zones reflect how the market gradually shifts value as participation increases.
ME-1 (Market Equilibrium @ 24290.30)
- The first equilibrium level marks the initial area where price finds temporary balance after beginning its expansion. It often acts as a structural reference for the developing move.
- Markets frequently revisit these equilibrium zones as part of normal structural progression.
L React (Long Price Reaction @ 24240.30)
- Price Reaction levels highlight areas where strong orderflow response begins to appear. These zones indicate where demand starts influencing the market structure.
- Such reactions often form the base from which a stronger directional move develops.
RL (Risk Limit @ 24210.30)
- Risk Limit defines the structural boundary of the setup and indicates where the current market structure would become invalid. It serves as a clear reference level for maintaining disciplined analysis.
- Holding above this level keeps the expansion structure intact during the move.
Phase-2: Continuation Phase (VC + CR)
ME-2 (Market Equilibrium @ 24405.00)
- Higher equilibrium levels reflect the market accepting price at progressively higher values. These levels act as structural checkpoints during continued movement.
- They help track how value migrates as the market continues its expansion.
ME-1 (Market Equilibrium @ 24355.00)
- This equilibrium level marks an intermediate balance area where price temporarily stabilizes. It often acts as a reference zone during continuation phases.
- Markets frequently rotate around such levels before progressing further.
L React (Long Price Reaction @ 24305.00)
- This price reaction level highlights where the market responded positively to orderflow participation. It represents the area where demand supported the continuation of the move.
- Price reactions at such levels often confirm the stability of the ongoing structure.
RL (Risk Limit @ 24275.00)
- Risk Limit continues to serve as the structural guardrail for the move. It clearly defines the level where the continuation structure would weaken if violated.
- Maintaining price above this boundary keeps the overall structure stable during the expansion.
Conclusion
This session demonstrates how structured market movements develop through Price Reactions, Risk Limits, and Market Equilibrium zones. Each level plays a role in revealing how the market transitions from initial expansion to continuation phases. By observing these objective reference levels along with VC, TR, UA, and CR concept alerts, traders can better understand the progression of price and the shifting balance between opposing participants. Bell Orderflow Ultimate helps visualize these structural levels clearly, enabling traders to interpret market behavior through data-driven orderflow insights.Maximize Your Trading Edge with Bell Orderflow Ultimate Visit www.belltpo.com or reach out to us for more details.