Educational Takeaway: Yesterday Net 200 Points Move Captured in NIFTY_I with VC + TBTS + UA + CR using Bell Orderflow Ultimate
This educational case study demonstrates how Bell Orderflow Ultimate highlighted a net 200-point structured movement in NIFTY_I using Cluster Zone (VC), Trapped Buyers/Trapped Sellers (TBTS), Unfinished Auction (UA), and COT Ratio (CR). The focus remains on auction behavior, value transitions, and risk-defined structure, strictly for educational understanding.
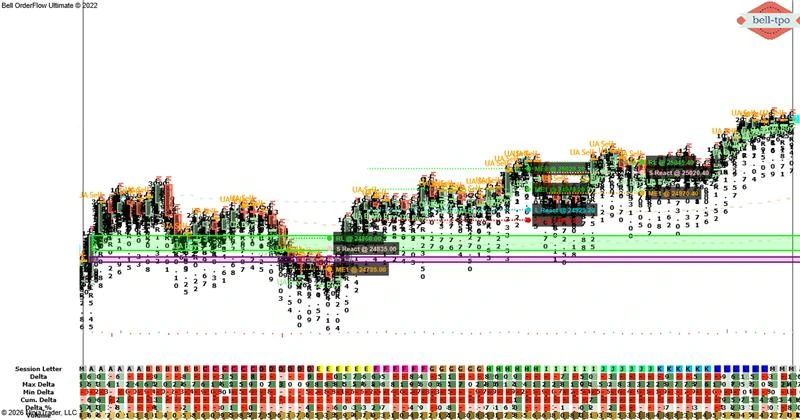
Phase-1: 50 Points Downside Structural Rotation (TBTS + CR + UA)
Market Equilibrium (ME Levels)
- ME-1 @ 24785.00 represented the first area of value acceptance during the rotational move.
- Interaction near this ME level reflected acceptance of lower prices within the auction process.
Price Reaction
- Short Price Reaction @ 24835.00 highlighted initiative activity following trapped participant behavior.
- The reaction aligned with unfinished auction structure, confirming directional intent.
Risk Limit
- Risk Limit @ 24860.00 defined the upper boundary for this phase’s structural validity.
- Price remaining below this level preserved the downside rotational context.
Phase-2: 100 Points Upside Value Expansion (VC + CR)
Market Equilibrium (ME Levels)
- ME-1 @ 24979.20 and ME-2 @ 25029.20 marked higher value acceptance zones.
- Sustained interaction around these levels indicated a clear shift in value distribution.
Price Reaction
- Long Price Reaction @ 24929.20 identified responsive participation from the newly accepted value area.
- The reaction confirmed structure-based continuation rather than random volatility.
Risk Limit
- Risk Limit @ 24904.20 acted as the downside protection level for this expansion phase.
- Holding above this level maintained the integrity of the upward auction structure.
Phase-3: 50 Points Downside Re-Rotation (TBTS + CR + UA)
Market Equilibrium (ME Levels)
- ME-1 @ 24970.40 highlighted renewed value acceptance at lower prices.
- This ME level confirmed a shift back toward balance after higher-level rejection.
Price Reaction
- Short Price Reaction @ 25020.40 captured initiative activity driven by trapped structure and UA.
- The reaction suggested controlled rotational behavior rather than emotional extension.
Risk Limit
- Risk Limit @ 25045.40 defined the structural invalidation boundary for this phase.
- Price respecting this level validated the downside re-rotation context.
Key Educational Observations
- Market Equilibrium levels mapped where value was accepted and migrated across phases.
- Price Reaction zones highlighted informed participation tied to auction structure.
- Risk Limits ensured discipline by clearly defining invalidation points in every phase.
Why Bell Orderflow Ultimate Makes the Difference
Bell Orderflow Ultimate is an advanced orderflow structure and alert system that delivers:
- Cluster Zone (VC) identification
- Trapped Buyers / Trapped Sellers (TBTS) detection
- Unfinished Auction (UA) alerts
- COT Ratio (CR) alignment with Market Equilibrium and Risk Limits
Together, these components help traders interpret auction behavior with structure, clarity, and control.
Conclusion
The session illustrated how Bell Orderflow Ultimate efficiently aligns market structure with volume confirmation through TBTS and UA alerts. By adhering to predefined risk limits and reaction zones, traders can observe disciplined execution and avoid impulsive decision-making.
This approach highlights the importance of structure-based trading — focusing on context and orderflow validation, rather than prediction. Such analysis helps traders understand intraday behavior, manage exposure effectively, and enhance consistency within a rules-based framework.
Maximize Your Trading Edge with Bell Orderflow Ultimate
Visit www.belltpo.com or reach out to us for more details.
Disclaimer
We are a software and indicator development company. This chart and analysis are for educational and informational purposes only. This is not investment advice or a recommendation to buy, sell, or trade any financial instrument. Users must conduct their own research before making any trading decisions. Past performance is not indicative of future results.