Educational Takeaway: Net 200 Points Move Captured in NIFTY_I with VC + TBTS + CR using Bell Orderflow Ultimate
Market movements often unfold in structured phases where price interacts with key orderflow levels before extending into larger directional expansions. Using Bell Orderflow Ultimate, traders can observe how Risk Limits, Price Reactions, and Market Equilibrium levels help reveal the internal mechanics of the market.
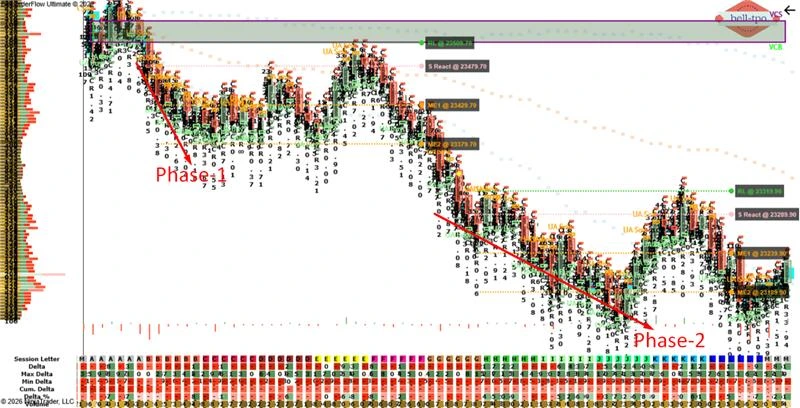
In this session, NIFTY_I delivered a net 200-point opportunity, where the move developed in two clear phases supported by VC, TBTS, and CR concept alerts.
Maximize Your Trading Edge with Bell Orderflow Ultimate Visit www.belltpo.com or reach out to us for more details.
Phase-1: Structured Expansion Phase (100 Points Move – VC + TBTS + CR)
RL (Risk Limit @ 23509.70)
- Risk Limit represents the structural boundary that defines the tolerance of the ongoing market setup. It helps identify the level beyond which the current structure would lose its validity.
- Such levels provide clarity in maintaining discipline while observing developing market movements.
S React (Short Price Reaction @ 23479.70)
- Short Price Reaction levels indicate zones where the market begins responding to supply within the orderflow. These reactions highlight areas where upward attempts encounter responsive pressure.
- Such reaction zones often act as structural points where momentum begins to shift.
ME-1 (Market Equilibrium @ 23429.70)
- Market Equilibrium levels represent areas where the market temporarily accepts price as fair value. These zones often act as checkpoints during directional movement.
- Price frequently pauses or rotates around these equilibrium areas before progressing further.
ME-2 (Market Equilibrium @ 23379.70)
- Higher-order equilibrium levels represent further stages of value migration during the move. Each equilibrium level reflects how the market continues reassessing value as participation increases.
- These levels remain important reference zones for understanding the progression of the move.
Phase-2: Continuation Phase (100 Points Move – TBTS + CR)
RL (Risk Limit @ 23319.90)
- Risk Limit once again acts as the structural guardrail for the continuation phase. It defines the level beyond which the existing market structure would weaken.
- This boundary helps maintain clarity while the market continues its expansion.
S React (Short Price Reaction @ 23289.90)
- Short Price Reaction levels indicate areas where supply continues to influence price behavior. These zones show where the market responds to upward attempts within the orderflow.
- Such reactions help confirm the continuation of the broader market structure.
ME-1 (Market Equilibrium @ 23239.90)
- The first equilibrium level in this phase represents the initial zone of temporary balance during the continuation move. Markets often stabilize around these levels before continuing the structural progression.
- These levels provide insight into how value migrates during the move.
ME-2 (Market Equilibrium @ 23189.90)
- Subsequent equilibrium levels represent deeper value areas where the market reassesses price acceptance. These zones often act as checkpoints during extended movements.
- Monitoring these levels helps traders understand how the market maintains structure during continuation phases.
Conclusion
This session highlights how markets can progress through multiple structured phases, with each phase defined by Risk Limits, Price Reactions, and Market Equilibrium zones. By observing these levels alongside VC, TBTS, and CR concept alerts, traders can better interpret how the market transitions from initial expansion to continuation phases. Bell Orderflow Ultimate provides a clear visualization of these structural levels, helping traders understand the flow of the market through objective orderflow-based references.Maximize Your Trading Edge with Bell Orderflow Ultimate Visit www.belltpo.com or reach out to us for more details.