Educational Takeaway: Net 200 Points Move captured in NIFTY_I with VC + CR using Bell Orderflow Ultimate
Today’s session in NIFTY_I delivered a structured 200-point value migration within a single continuous phase. The move was identified through the alignment of VC and CR, which confirmed participation imbalance and progressive equilibrium shift.
This development reflected controlled structure, where price transitioned sequentially from reaction zone toward lower equilibrium levels.
Maximize Your Trading Edge with Bell Orderflow Ultimate Visit www.belltpo.com or reach out to us for more details.
Single Phase Structure
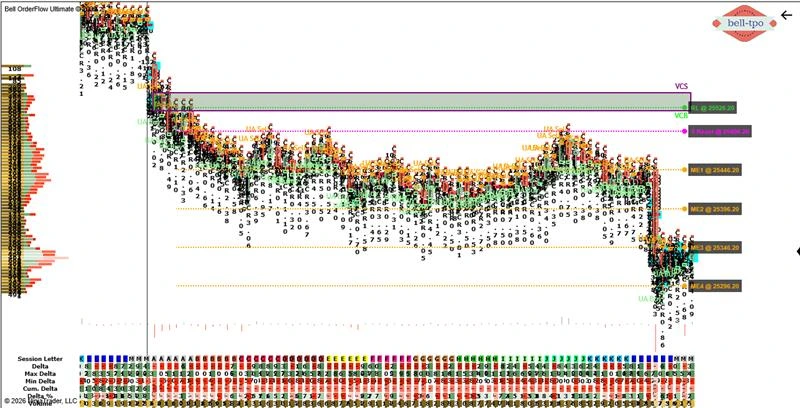
Risk Limit – 25526.20
- The Risk Limit defined the structural boundary for the entire session.
- Price remaining below this level maintained directional control and structural stability.
S React – 25496.20
- The Short Price Reaction marked the initial participation shift within the session.
- VC formation aligned with CR confirmation, validating the start of structured expansion.
ME-1 – 25446.20
- ME-1 formed as the first equilibrium following initial displacement.
- A brief balance occurred here before continuation toward lower value.
ME-2 – 25396.20
- ME-2 reflected progressive acceptance at a lower equilibrium zone.
- Sustained activity around this level confirmed continued structural strength.
ME-3 – 25346.20
- ME-3 acted as another structured pause within the ongoing move.
- Balanced prints appeared temporarily before further value migration.
ME-4 – 25296.20
- ME-4 marked the final equilibrium in this 200-point sequence.
- The cumulative migration from reaction zone to ME-4 reflected sustained orderflow dominance.
Educational Observations
- Risk Limit anchors structural discipline and defines invalidation.
- Price Reaction reveals the initial imbalance and participation shift.
- Each Market Equilibrium tracks progressive value migration.
- VC highlights key institutional activity zones.
- CR confirms continuation through imbalance validation.
Maximize Your Trading Edge with Bell Orderflow Ultimate Visit www.belltpo.com or reach out to us for more details.