Educational Takeaway: Net 150 Points captured in NIFTY_I with TBTS + CR + UA using Bell Orderflow Ultimate
Today’s session in NIFTY_I highlighted how a structured combination of TBTS + CR + UA can help read directional intent and follow price acceptance and rejection logically. The market offered opportunities on both sides, resulting in a net 150-point move, captured across two distinct phases using Bell Orderflow Ultimate.
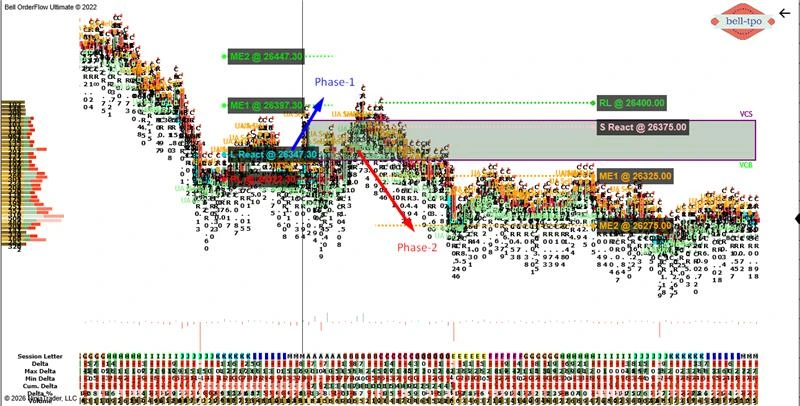
Phase 1: Upside Structure and Acceptance
The initial phase reflected strong participation supported by TBTS, CR, and UA, indicating sustained activity rather than a one-candle reaction. The market respected internal references and extended higher with balance-based progression.
Market Equilibrium (ME-1 @ 26397.30)
- ME-1 acted as a key acceptance zone where price consolidated before continuing higher.
- This level confirmed balance expansion and helped maintain directional confidence during the upside move.
Long Price Reaction (L React @ 26347.30)
- The long price reaction zone highlighted responsive activity, showing demand-side participants stepping in at expected references.
- This reaction validated continuation rather than exhaustion.
Risk Limit (RL @ 26322.30)
- The risk limit defined the invalidation point for the upside structure.
- As long as price stayed above this level, the broader structure remained intact and controlled.
Phase 2: Downside Rotation and Extension
Post the upside completion, the market transitioned into a downside phase, again supported by TBTS + CR + UA, signaling active participation on the other side. This phase was a rotational move with clear acceptance at lower levels.
Market Equilibrium Levels
- ME-1 @ 26325.00 acted as the first balance area during the decline, where price briefly paused before extending further.
- ME-2 @ 26275.00 marked deeper acceptance, confirming downside continuation and range extension.
Short Price Reaction (S React @ 26375.00)
- The short price reaction zone reflected responsive supply-side activity from higher references.
- This reaction provided clarity that the upside was complete and rotation had begun.
Risk Limit (RL @ 26400.00)
- The risk limit defined the upper boundary for downside acceptance.
- As price stayed below this level, the bearish rotation structure remained valid.
Key Learning
The session clearly demonstrated how TBTS, CR, and UA, when aligned, help identify participation strength, structure integrity, and directional continuation. Instead of focusing on predictions, reading equilibrium, reaction zones, and risk limits allows traders to stay aligned with market behavior across both sides.
Note
- TBTS represents trapped participation activity
- CR refers to COT ratio dynamics
- UA highlights unfinished auction zones
Conclusion
The session illustrated how Bell Orderflow Ultimate efficiently aligns market structure with volume confirmation through TBTS and UA alerts. By adhering to predefined risk limits and reaction zones, traders can observe disciplined execution and avoid impulsive decision-making.
This approach highlights the importance of structure-based trading — focusing on context and orderflow validation, rather than prediction. Such analysis helps traders understand intraday behavior, manage exposure effectively, and enhance consistency within a rules-based framework.
Maximize Your Trading Edge with Bell Orderflow Ultimate
Visit www.belltpo.com or reach out to us for more details.
Disclaimer
We are a software and indicator development company. This chart and analysis are for educational and informational purposes only. This is not investment advice or a recommendation to buy, sell, or trade any financial instrument. Users must conduct their own research before making any trading decisions. Past performance is not indicative of future results.