Educational Takeaway: Net 125 Points Move Captured in NIFTY_I with VC Zone + TR Alert + TBTS + CR using Bell Orderflow Ultimate
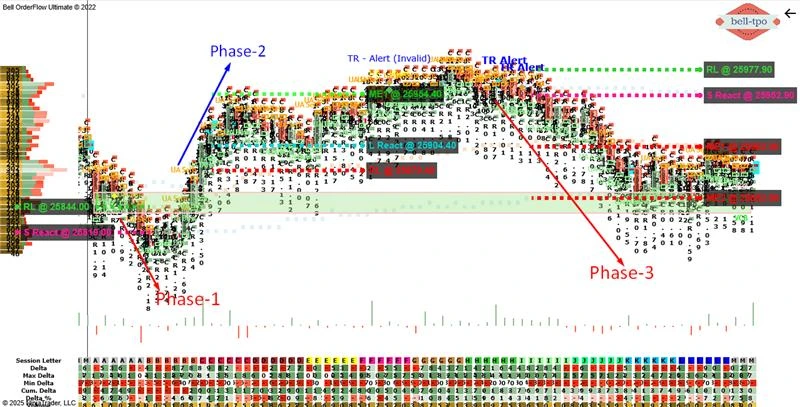
This session in NIFTY_I clearly demonstrated how Orderflow-based references like the VC Zone, TR Alert, TBTS, and CR can guide market structure understanding across multiple phases. Each phase unfolded with well-defined price reactions, controlled risk limits, and meaningful market equilibrium responses—highlighting the importance of context over prediction.
Phase 1 – Initial Downside Attempt (Risk Limit Hit)
Risk Limit (RL @ 25844)
- The predefined risk boundary was tested early, showing that downside acceptance was limited at this stage. This reinforced the importance of respecting risk parameters when the market does not follow through.
- The hit at the risk limit signaled a pause rather than continuation, indicating a lack of sustained participation below this level.
Price Reaction (S React @ 25819)
- The short-side price reaction emerged quickly but lacked follow-through, suggesting temporary initiative rather than strong control.
- This reaction helped identify early rejection rather than a trend-building move.
Phase 2 – Responsive Upside Development
Risk Limit (RL @ 25879.40)
- The revised risk limit provided a clear reference for upside continuation without emotional bias.
- Holding above this level confirmed stability and encouraged continuation toward higher acceptance areas.
Price Reaction (L React @ 25904.40)
- The price reaction showed a clean response from lower references, reflecting active participation.
- This reaction confirmed strength emerging after the failed downside attempt.
Market Equilibrium (ME-1 @ 25954.40)
- ME-1 acted as a natural balance area where price slowed and reassessed value.
- This equilibrium highlighted fair pricing after the upside expansion.
Phase 3 – Strong Downside Expansion
Risk Limit (RL @ 25977.90)
- The upper risk limit clearly defined where acceptance failed, providing structure for the downside move.
- Rejection from this zone confirmed that higher prices were not being sustained.
Price Reaction (S React @ 25952.90)
- The downside price reaction was sharp and decisive, indicating stronger initiative than earlier phases.
- This reaction aligned well with Orderflow confirmations, showing increased participation.
Market Equilibrium Levels (ME-1 @ 25902.90 & ME-2 @ 25852.90)
- ME-1 served as the first balance point where the market briefly stabilized.
- ME-2 marked deeper value acceptance, completing the downside structure with clarity.
Conclusion
The session illustrated how Bell Orderflow Ultimate efficiently aligns market structure with volume confirmation through TBTS and UA alerts. By adhering to predefined risk limits and reaction zones, traders can observe disciplined execution and avoid impulsive decision-making.
This approach highlights the importance of structure-based trading — focusing on context and orderflow validation, rather than prediction. Such analysis helps traders understand intraday behavior, manage exposure effectively, and enhance consistency within a rules-based framework.
Maximize Your Trading Edge with Bell Orderflow Ultimate
Visit www.belltpo.com or reach out to us for more details.
Disclaimer
We are a software and indicator development company. This chart and analysis are for educational and informational purposes only. This is not investment advice or a recommendation to buy, sell, or trade any financial instrument. Users must conduct their own research before making any trading decisions. Past performance is not indicative of future results.