Educational Takeaway: Net 100 Points Move Captured in NIFTY_I with VC Zone + MR + TBTS + UA + CR using Bell Orderflow Ultimate
Today’s market followed a clear downside structure guided by the VC Zone, TBTS, UA, MR, and CR alerts from Bell Orderflow Ultimate. The move unfolded in a controlled manner through each Market Equilibrium layer, allowing the auction to flow cleanly from one reference to the next.
Phase Overview
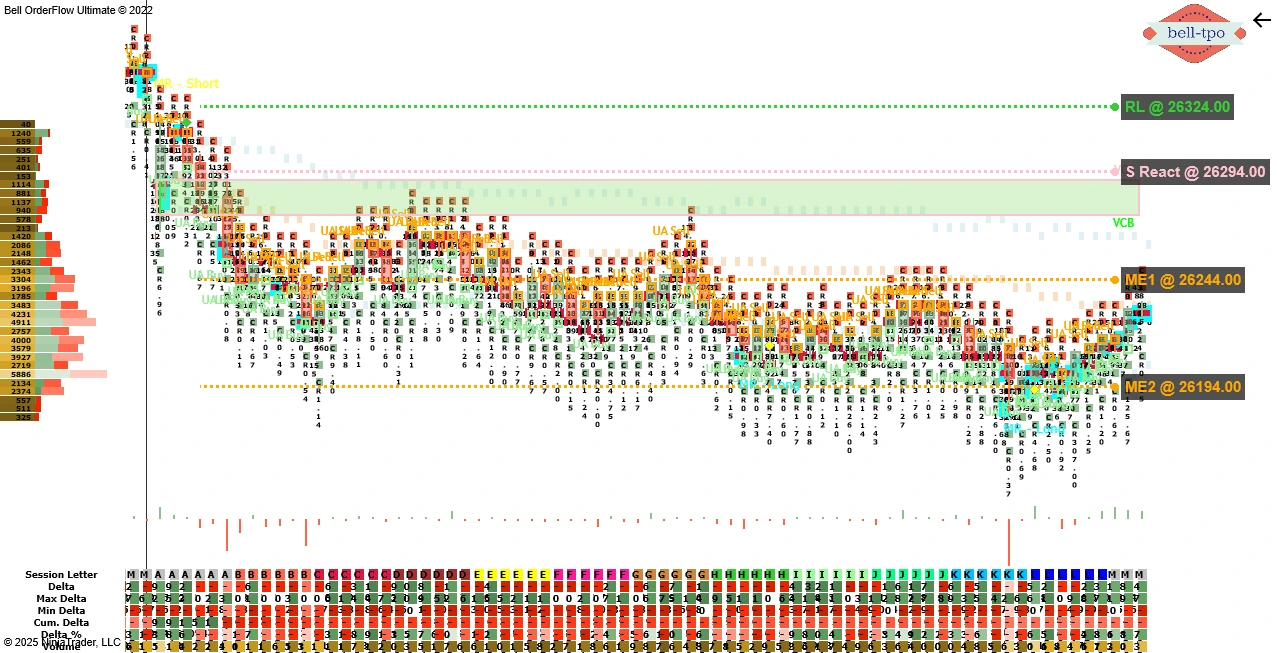
Risk Limit (RL @ 26324)
- The Risk Limit set the upper boundary for the auction, defining where continuation strength would be invalidated.
- Price remaining below this level confirmed that the market was ready to explore lower references with stability.
Short Price Reaction (S React @ 26294)
- This reaction level acted as the first confirmation point for directional intent.
- Holding below it indicated steady acceptance of lower prices as the auction transitioned away from overhead supply.
Market Equilibrium-1 (ME-1 @ 26244)
- ME-1 served as the first balancing zone where the auction paused and reorganized.
- Smooth movement through this level reflected a healthy continuation of the developing imbalance.
Market Equilibrium-2 (ME-2 @ 26194)
- ME-2 functioned as the deeper equilibrium layer and a natural level for the directional flow.
- Price behavior around this zone confirmed the strength and completeness of the auction.
Conclusion
The session illustrated how Bell Orderflow Ultimate efficiently aligns market structure with volume confirmation through TBTS and UA alerts. By adhering to predefined risk limits and reaction zones, traders can observe disciplined execution and avoid impulsive decision-making.
This approach highlights the importance of structure-based trading — focusing on context and orderflow validation, rather than prediction. Such analysis helps traders understand intraday behavior, manage exposure effectively, and enhance consistency within a rules-based framework.
Maximize Your Trading Edge with Bell Orderflow Ultimate
Visit www.belltpo.com or reach out to us for more details.
Disclaimer
We are a software and indicator development company. This chart and analysis are for educational and informational purposes only. This is not investment advice or a recommendation to buy, sell, or trade any financial instrument. Users must conduct their own research before making any trading decisions. Past performance is not indicative of future results.