Educational Takeaway: 400 Points Move captured in YMDEC25 with CR + TBTS + VC Zone + UA using Bell Orderflow Ultimate
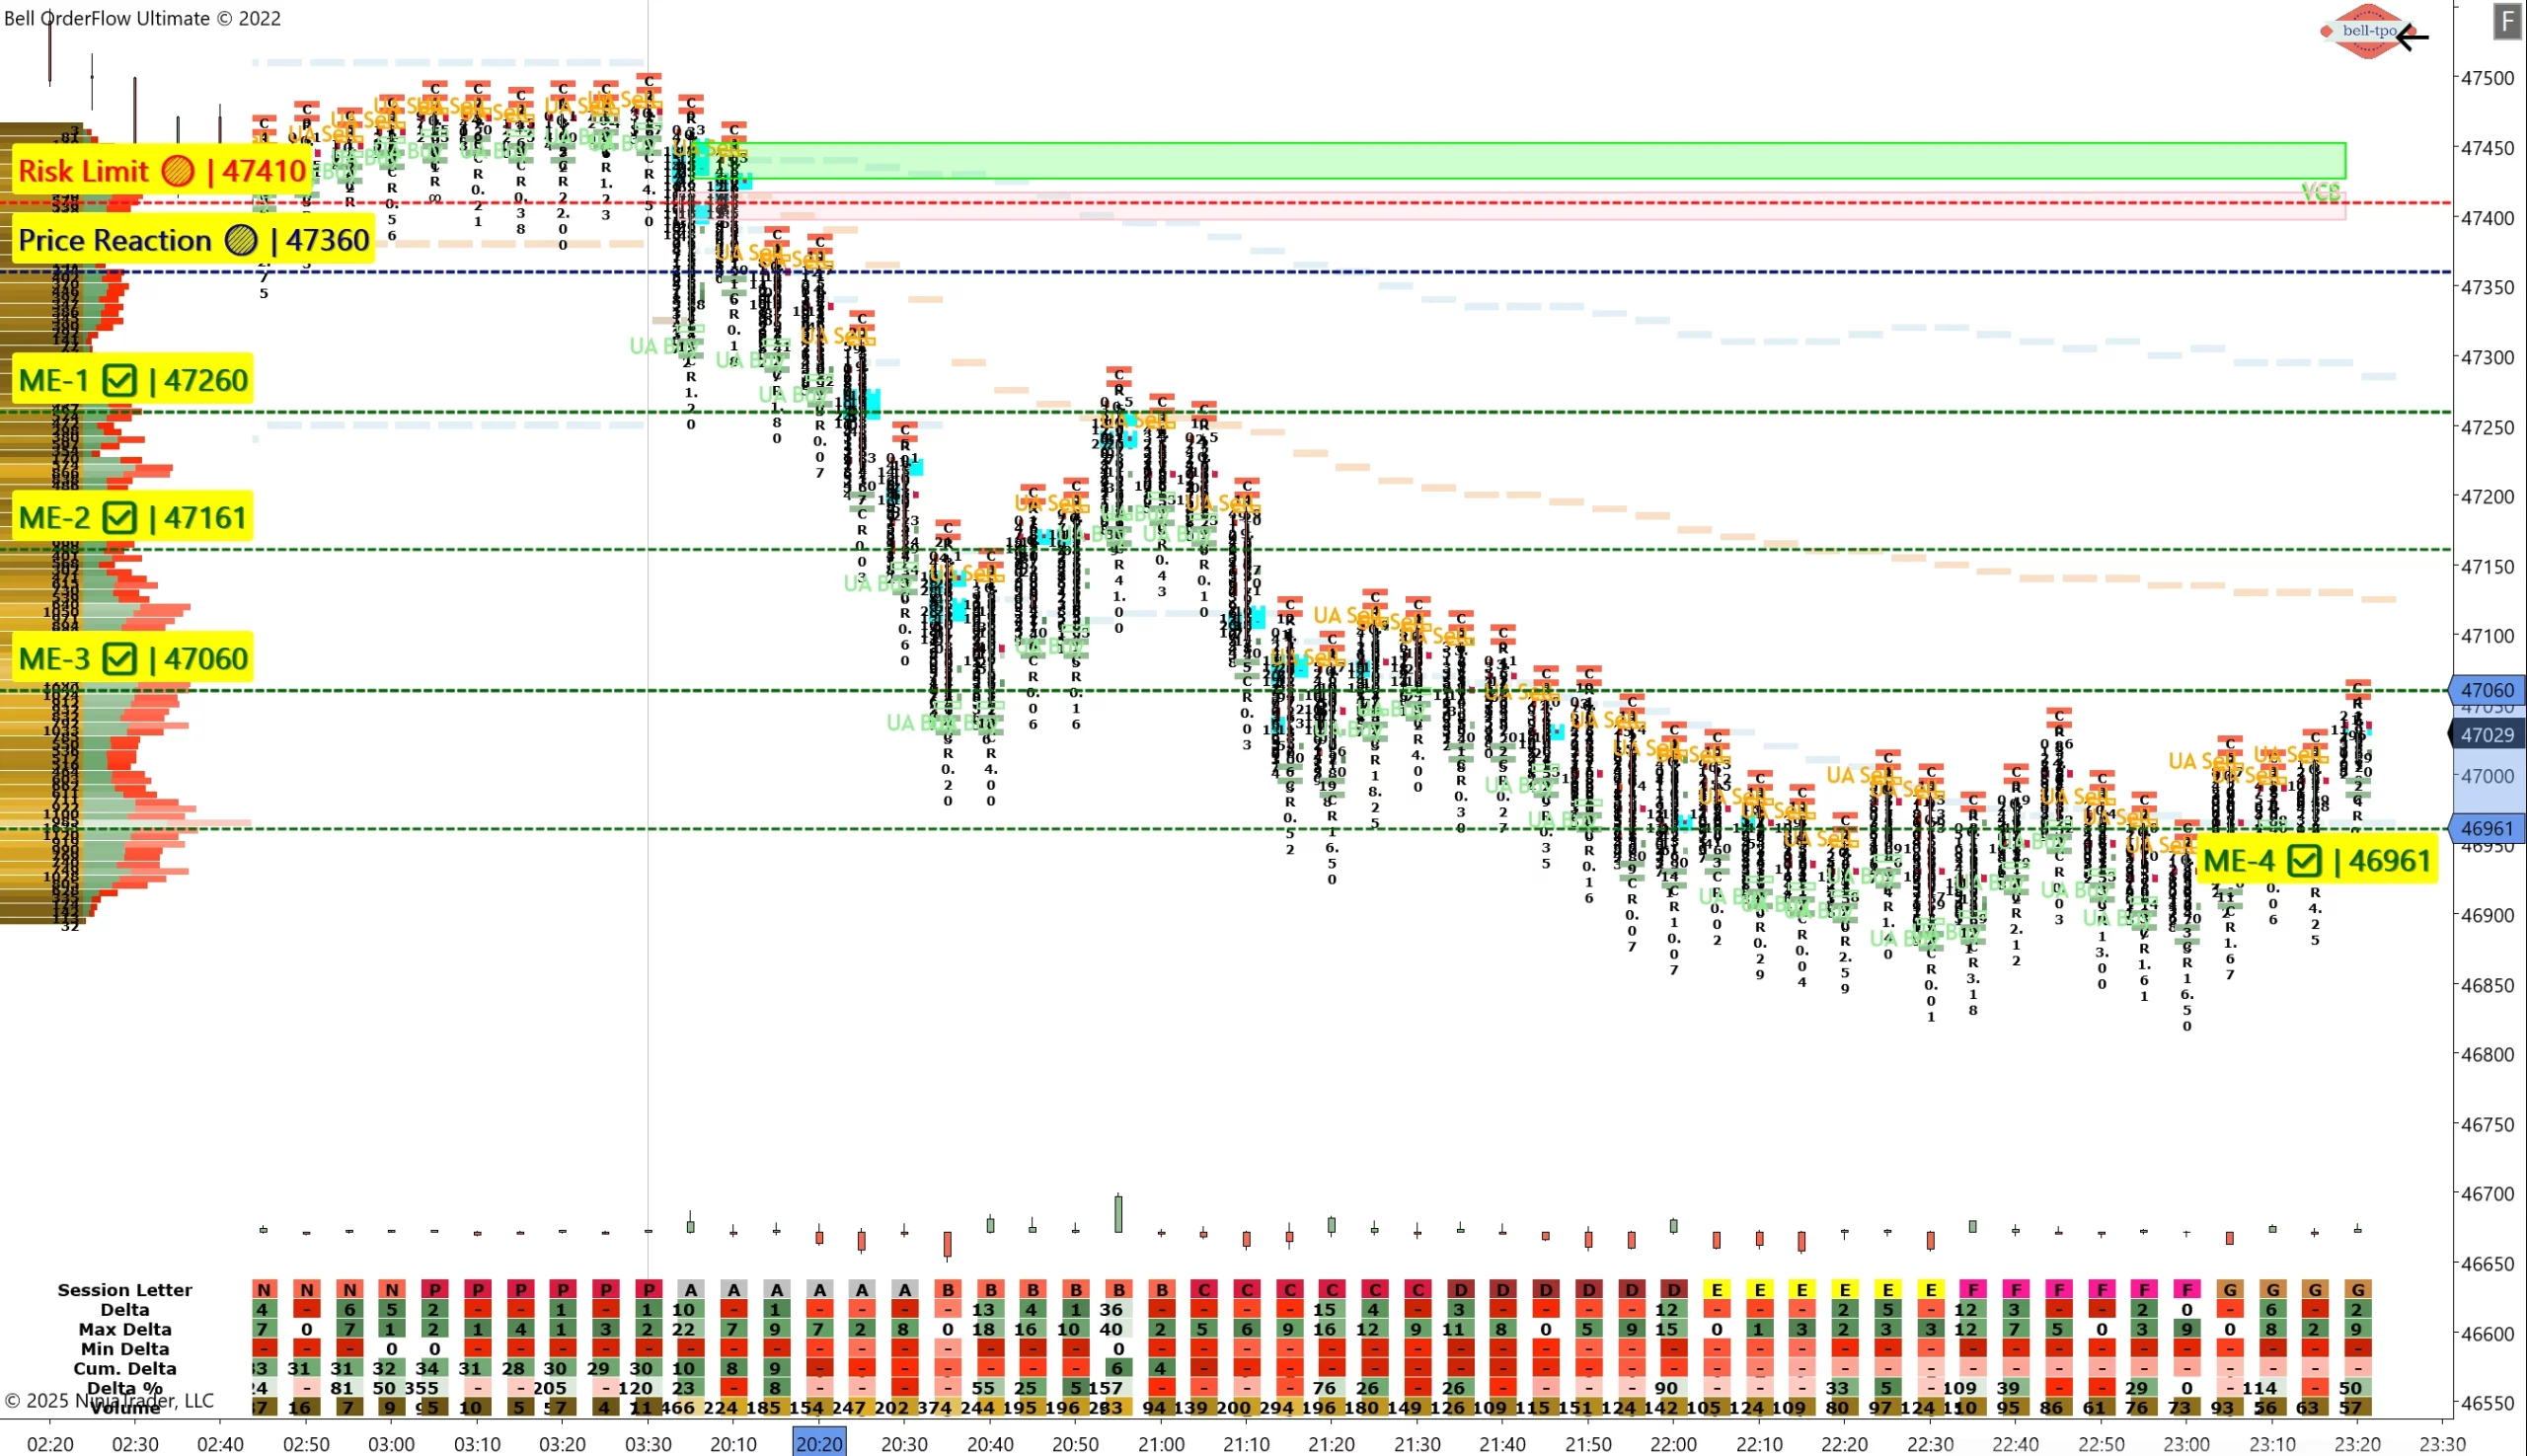
The session offered a clean opportunity to participate in a controlled downside move as price reacted at a key contextual reference zone. The convergence of VC Zone alignment, TBTS shift and UA confirmation provided the initiation signal. Once the CR level was validated, price began to rotate lower in a structured manner across multiple measured exit (ME) zones.
Phase-1: Short Move (400 Points Captured)
Price Reaction @47360:
Initiation point where selling pressure first responded. Confirmed shift in auction behavior leading to directional move.
Risk Limit @47410:
Protective reference ensuring trade validity while below this level. If price had moved above this, bearish control would be considered lost.
ME-1 @47260:
First scale-out confirming continuation from reaction zone. Reduces position risk while validating directional conviction.
ME-2 @47161:
Second objective aligning with sustained selling interest. Shows follow-through and participation by aggressive sellers.
ME-3 @47060:
Deeper push into lower auction structure. Captures momentum while allowing the trend to extend naturally.
ME-4 @46961:
Final target completing the 400 points move. Ideal exit zone where momentum slowed and balancing was likely to occur.
Conclusion
The session illustrated how Bell Orderflow Ultimate efficiently aligns market structure with volume confirmation through VC, TBTS, and UA alerts. By adhering to predefined risk limits and reaction zones, traders can observe disciplined execution and avoid impulsive decision-making.
This approach highlights the importance of structure-based trading — focusing on context and orderflow validation, rather than prediction. Such analysis helps traders understand intraday behavior, manage exposure effectively, and enhance consistency within a rules-based framework.
Maximize Your Trading Edge with Bell Orderflow Ultimate
Visit www.belltpo.com or reach out to us for more details.
Disclaimer
We are a software and indicator development company. This chart and analysis are for educational and informational purposes only. This is not investment advice or a recommendation to buy, sell, or trade any financial instrument. Users must conduct their own research before making any trading decisions. Past performance is not indicative of future results.