Bell Orderflow Ultimate Highlights Volume-Based Reaction Zones – 180 Points Observed
Today’s session offered a clear illustration of how volume-based structures using Bell Orderflow Ultimate helped identify key reaction zones on both sides of the market. The session unfolded with two major phases:
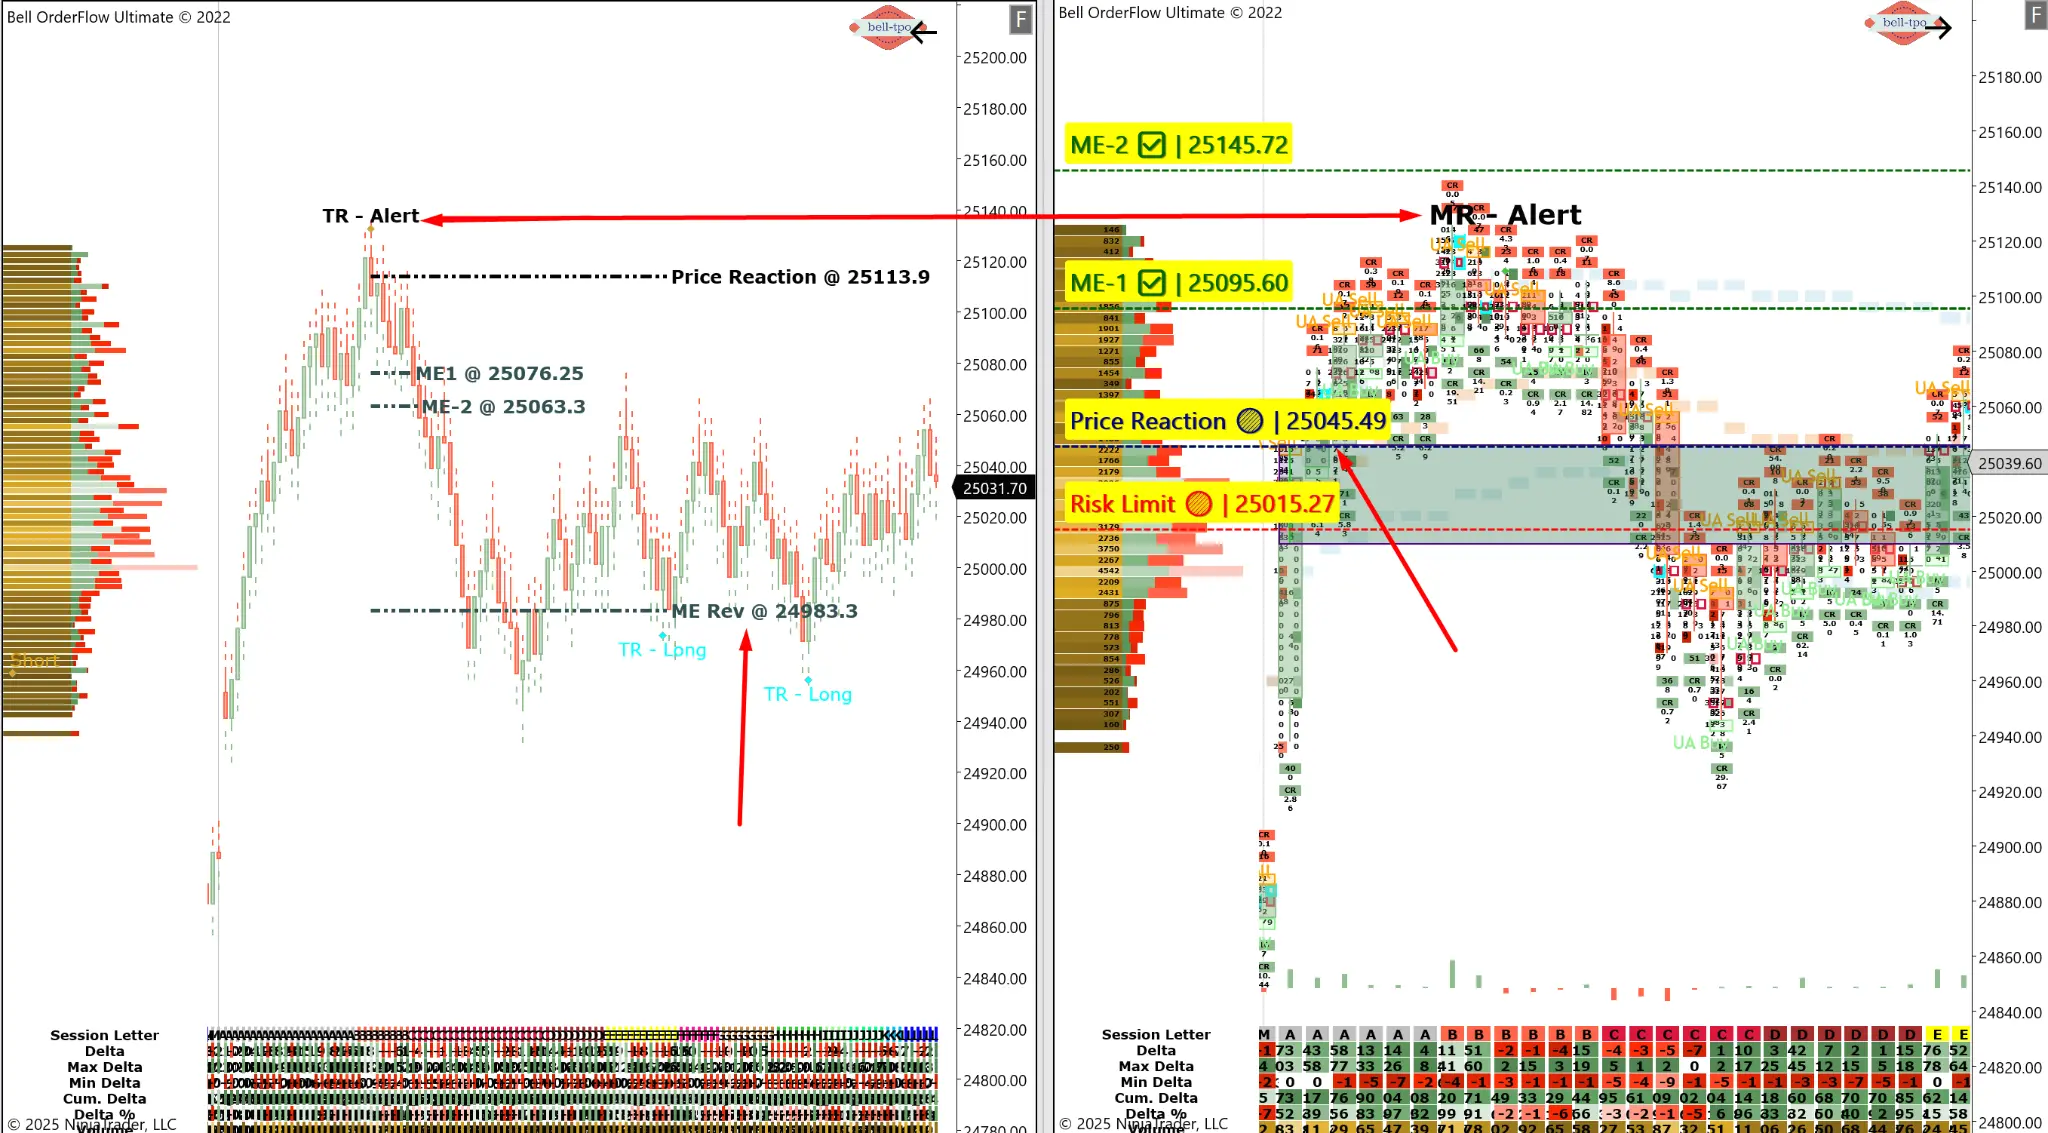
🔹 Phase 1: Observing VC-Zone Volume Response with Price Reaction
In the earlier part of the day, price interacted with a VC-Zone that had previously acted as a balanced region. This interaction was accompanied by a Price Reaction @ 25045.49, supported by:
- Risk Limit @ 25015.27
- Followed by movement through:
- ME-1 @ 25095.60
- ME-2 @ 25145.72
📊 These levels illustrate how price typically transitions between Market Equilibrium zones after reacting from key volume clusters. This zone-based observation reflected a move of approximately 50 points within the ME framework.
🧠 VC-Zones are volume-defined balance areas. When price revisits these, traders can study absorption or rejection patterns to understand the broader structural response.
🔻 Phase 2: MR-Alert + TR-Alert Confluence at Session High
Later in the session, a notable structural development occurred:- A TR-Alert (Trap Reversal) formed near the Price Reaction zone @ 25113.9
- Simultaneously, an MR-Alert (Momentum Reversal) triggered from the same region
- ME-1 @ 25076.25
- ME-2 @ 25063.3
- Final reaction zone seen near ME Rev @ 24983.3
🧠 TR-Alert indicates areas where one-sided participation may get trapped, while MR-Alert highlights a shift in market control based on real-time delta dynamics.
This phase showcased a reaction spanning around 130 points, offering valuable learning around alert confluence and ME progression.
🧩 What This Session Teaches
- ⚖️ Volume structure, not direction, is key to understanding market behavior
- ✅ Alerts (VC-Zone, TR, MR) help observe crowd behavior and institutional pressure
- 🔁 ME levels offer logical checkpoints for price rotation, continuation, or fade analysis
🚨 Disclaimer:
We are a software and indicator development company. This chart and analysis are for educational and informational purposes only. This is not investment advice or a recommendation to buy, sell, or trade any financial instrument. Users must conduct their own research before making any trading decisions. Past performance is not indicative of future results.