Bell Market Profile + Orderflow: Technical Breakdown of Today’s Price Action
Here’s a structured review of today’s session using Bell Market Profile Ultimate and Bell Orderflow Ultimate. These observations are purely for educational purposes and highlight how structure-based alerts helped identify directional movement:
🟢 1. VC-Zone Based Long – Early Exit Due to Trap Conditions
The session opened with a long opportunity from the VC-Zone. While the move initially showed promise, emerging signs of trapped buyers and a subsequent TR-Short alert prompted a cautious early exit—resulting in a limited loss of approximately 25 points.
🔴 2. TR-Short Opportunity After Trap Confirmation – 105 Points Move (For Study Purpose)
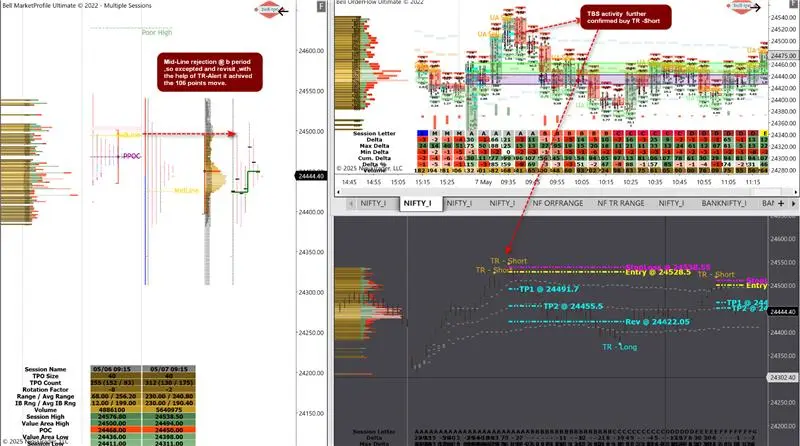
Post the trapped buyer signal, the TR-Short alert was activated and further supported by TBS activity. This alignment signaled a strong downward move, leading to a 105-point price reaction observed after the entry—demonstrating how order flow can guide directional bias.
🔴 3. Mid-Line Rejection at B Period – 106 Points Move (For Educational Reference)
A mid-line rejection during the B period marked a critical structural turning point. With TR-Alert at c period confirming the shift in control, price moved directionally for 106 points on long side, highlighting the effectiveness of profile-based intraday references along with TBS and TR-Alert.
🔎 Summary (All Values for Learning Purpose Only):
- Total Observed Positive Move: 105 + 106 = 211 points
- Drawdown Due to Early Exit: -25 points
- Net Price Movement Observed: ⚖️ 186 points
📘 Disclaimer:
This article is intended for educational and informational purposes only. It does not constitute investment advice or a recommendation to buy, sell, or trade any financial instrument. All observations are based on historical market activity and are not indicative of future performance. We are a software and indicator development company. Please consult a SEBI-registered financial advisor before making any investment decisions.