295-Point Move Captured in NIFTY_I – 200 Points with VC-Zone Alert + 95 Points with MR-Alert & UA Alert
🔹 First 90 Minutes Delivered 200 Points | 🔸 Followed by 95 Points Structured Reversal
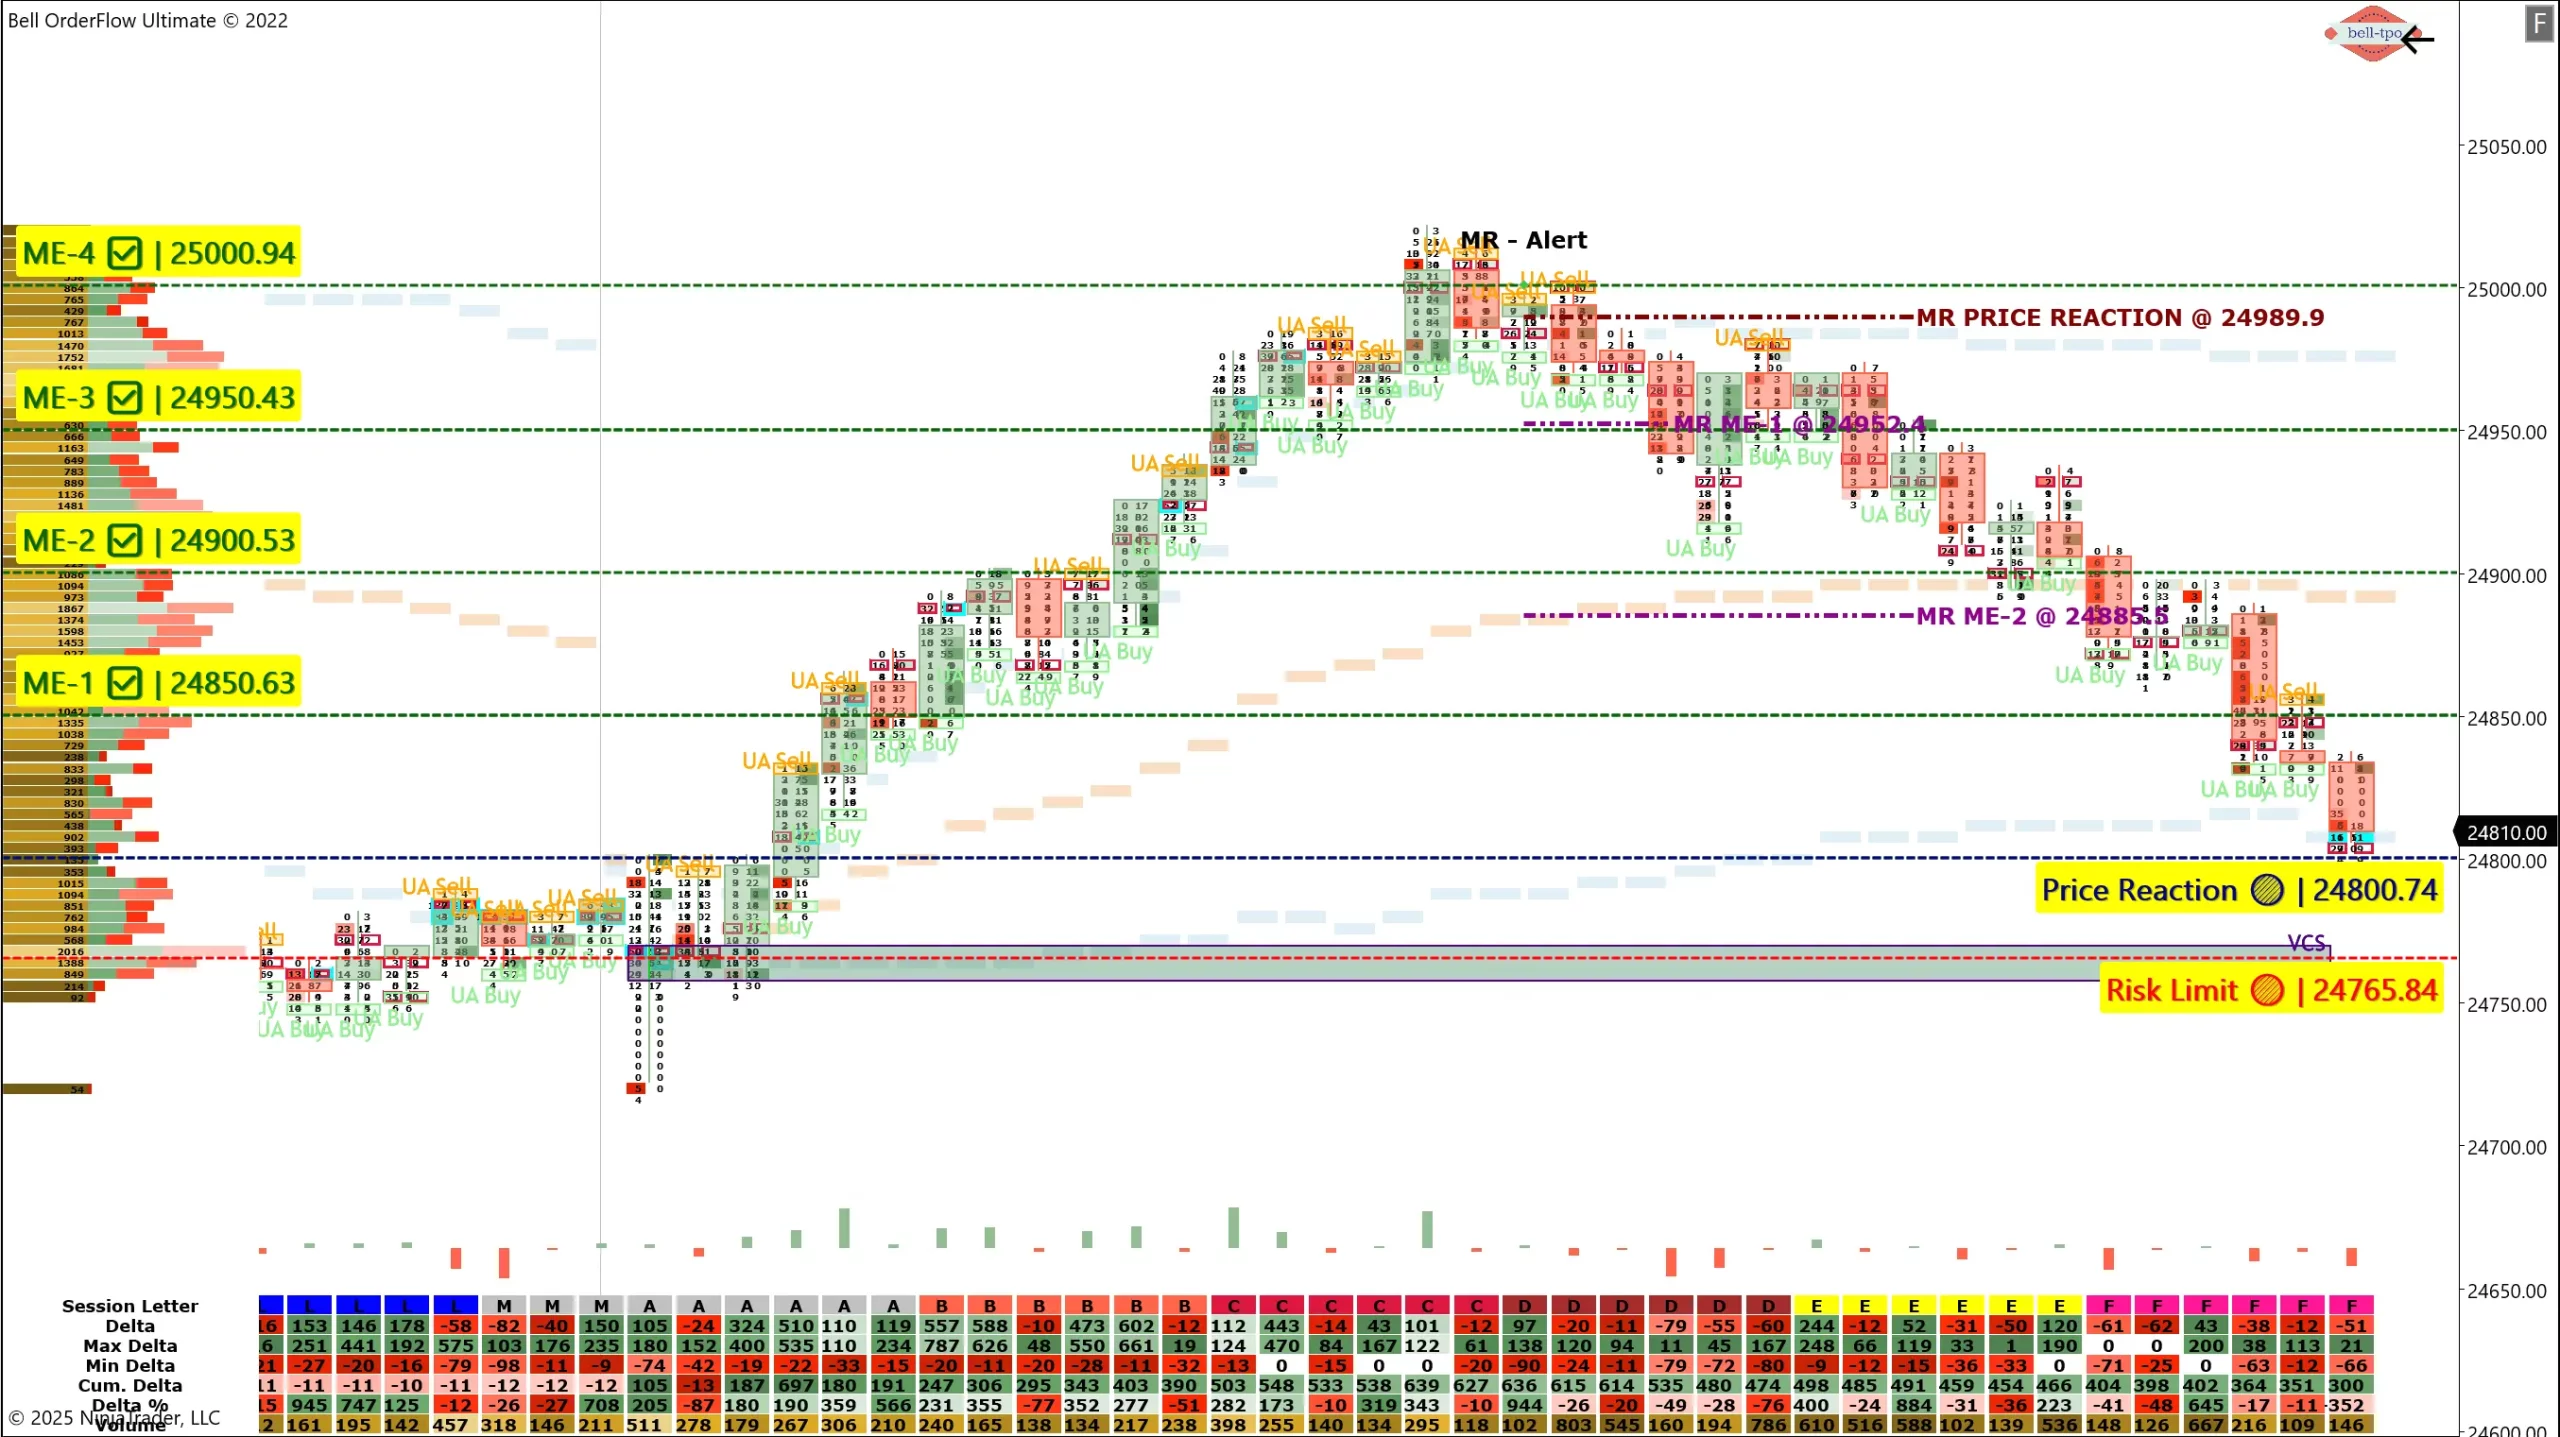
Today’s session in NIFTY_I was a showcase of precision and structure using Bell Orderflow Ultimate. The market delivered a total 295-point move, broken into two clear phases:
- Phase 1: A 200-point upmove in the first 90 minutes, guided by VC-Zone Alert and Market Equilibrium Levels.
- Phase 2: A 95-point reversal, initiated by the MR-Alert (Momentum Reversal) and confirmed through UA Alerts (Unfinished Auctions), indicating strong market reaction from the day high.
🔍 Market Structure Flow:
🟡 Initial Price Reaction @ 24800.74
The foundation of the day’s directional move, marking the beginning of structural interest.
🔴 Risk Limit @ 24765.84
Defined early control of downside risk. This zone helped validate the strength of the initial rotation.
🟢 Market Equilibrium Progression (ME-1 to ME-4)
Price moved structurally through ME-1 @ 24850.63 ➡️ ME-4 @ 25000.94, showing controlled buyer activity and well-balanced auction behavior.
🔔 MR-Alert (Momentum Reversal) @ 24989.9
Triggered at the upper extreme after the full upward rotation, this marked the beginning of a shift in price behavior — moving from initiative to responsive activity.
🔄 UA Alerts (Unfinished Auction Signals)
Post MR-Alert, UA Buy and Sell activity near the highs provided further structure and confirmation for the 95-point move back toward lower equilibrium zones.
🟣 Revisit of MR ME-2 @ 24885.5 and Final Reaction @ 24800.74
These acted as final checkpoints, wrapping up a clean and responsive full-structure session.
✅ Session Recap: 295 Points Captured via Structured Flow
- 200 Points: Captured in first 90 mins via VC-Zone Alert & ME logic
- 95 Points: Captured via MR-Alert + UA Alerts from upper rejection zones Every move followed volume logic and structured reference — not arbitrary signals.
🔗 Visit 👉 www.belltpo.com
📢 Disclaimer:We are a software and indicator development company. This chart and analysis are for educational and informational purposes only. This is not investment advice or a recommendation to buy, sell, or trade any financial instrument. Users must conduct their own research before making any trading decisions. Past performance is not indicative of future results.