170 Points Captured with VC Zone & TBTS Alert – A Structured Move Explained
Today’s market activity presented a textbook example of structured trading using the Bell OrderFlow Ultimate system. The session was split into two distinct phases—each defined by Price Reaction and Risk Limit parameters—driven by our proprietary VC Zone and TBTS alerts.
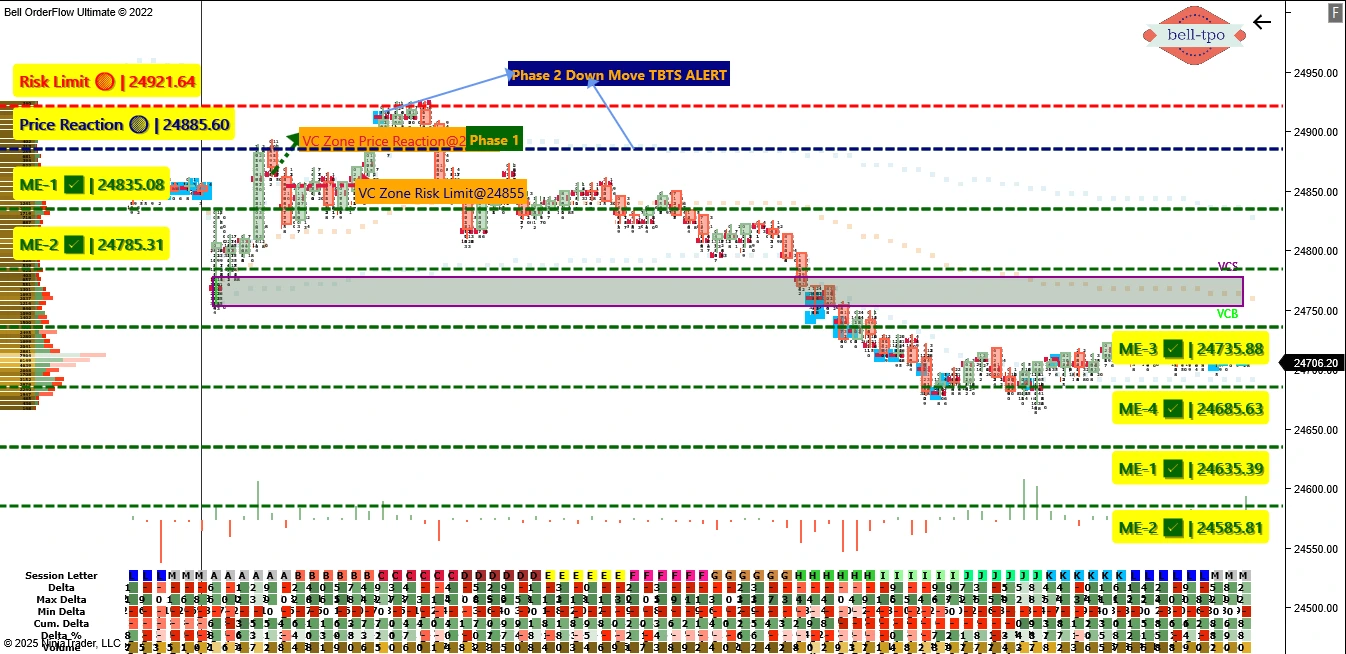
Phase 1: Up Move Attempt – VC Zone Failed
- VC Zone Price Reaction: 24885
- VC Zone Risk Limit: 24855 Despite an initial upward move in Phase 1, the market failed to sustain above the VC Zone Risk Limit. This resulted in a stop-out with a controlled loss of 30 points. Such events serve as reminders of why respecting the Risk Limit is non-negotiable in any trading system.
Phase 2: Down Move – TBTS Alert Driven
- Price Reaction: 24885.60
- Risk Limit: 24921.64 Following the failed upside, the market signaled a shift with a TBTS down-move alert. The downtrend respected the Risk Limit and unfolded in a highly structured fashion.
Move Extensions:
- ME-1: 24835.08 The first extension validated the directional conviction and built confidence in trend continuity.
- ME-2: 24785.31 A clean follow-through move, strengthening the downtrend momentum.
- ME-3: 24735.88 By this stage, sellers had full control, and the price action remained disciplined around the plotted zones.
- ME-4: 24685.63 This level marked a significant milestone—completing a 200-point gross move from the Risk Limit, with a net capture of 170 points after adjusting Phase 1 loss.
Conclusion
The Bell OrderFlow Ultimate framework empowers traders with predefined Price Reaction and Risk Limit zones, supported by TBTS and VC alerts to stay on the right side of the market. Today’s sequence demonstrated- Importance of respecting the Risk Limit (Phase 1 loss),
- Precision of alert-based decision-making (Phase 2 gain),
- And the power of objective execution over emotion.
Maximize Your Trading Edge with Bell Orderflow Ultimate
Visit www.belltpo.com or reach out to us for more details.
🚨 Disclaimer: We are a software and indicator development company. This chart and analysis are for educational and informational purposes only. This is not investment advice or a recommendation to buy, sell, or trade any financial instrument. Users must conduct their own research before making any trading decisions. Past performance is not indicative of future results.