150 Points Structured Move Captured Using Bell Orderflow Ultimate
Today in NIFTY_I, a well-structured 150-point move was identified with a TBTS (Trend Breakout Trend Support) alert in Bell Orderflow Ultimate. This setup was further strengthened by a TR-Alert (Trend Reversal) confirmation — both of which are part of Orderflow concepts used for market structure analysis.
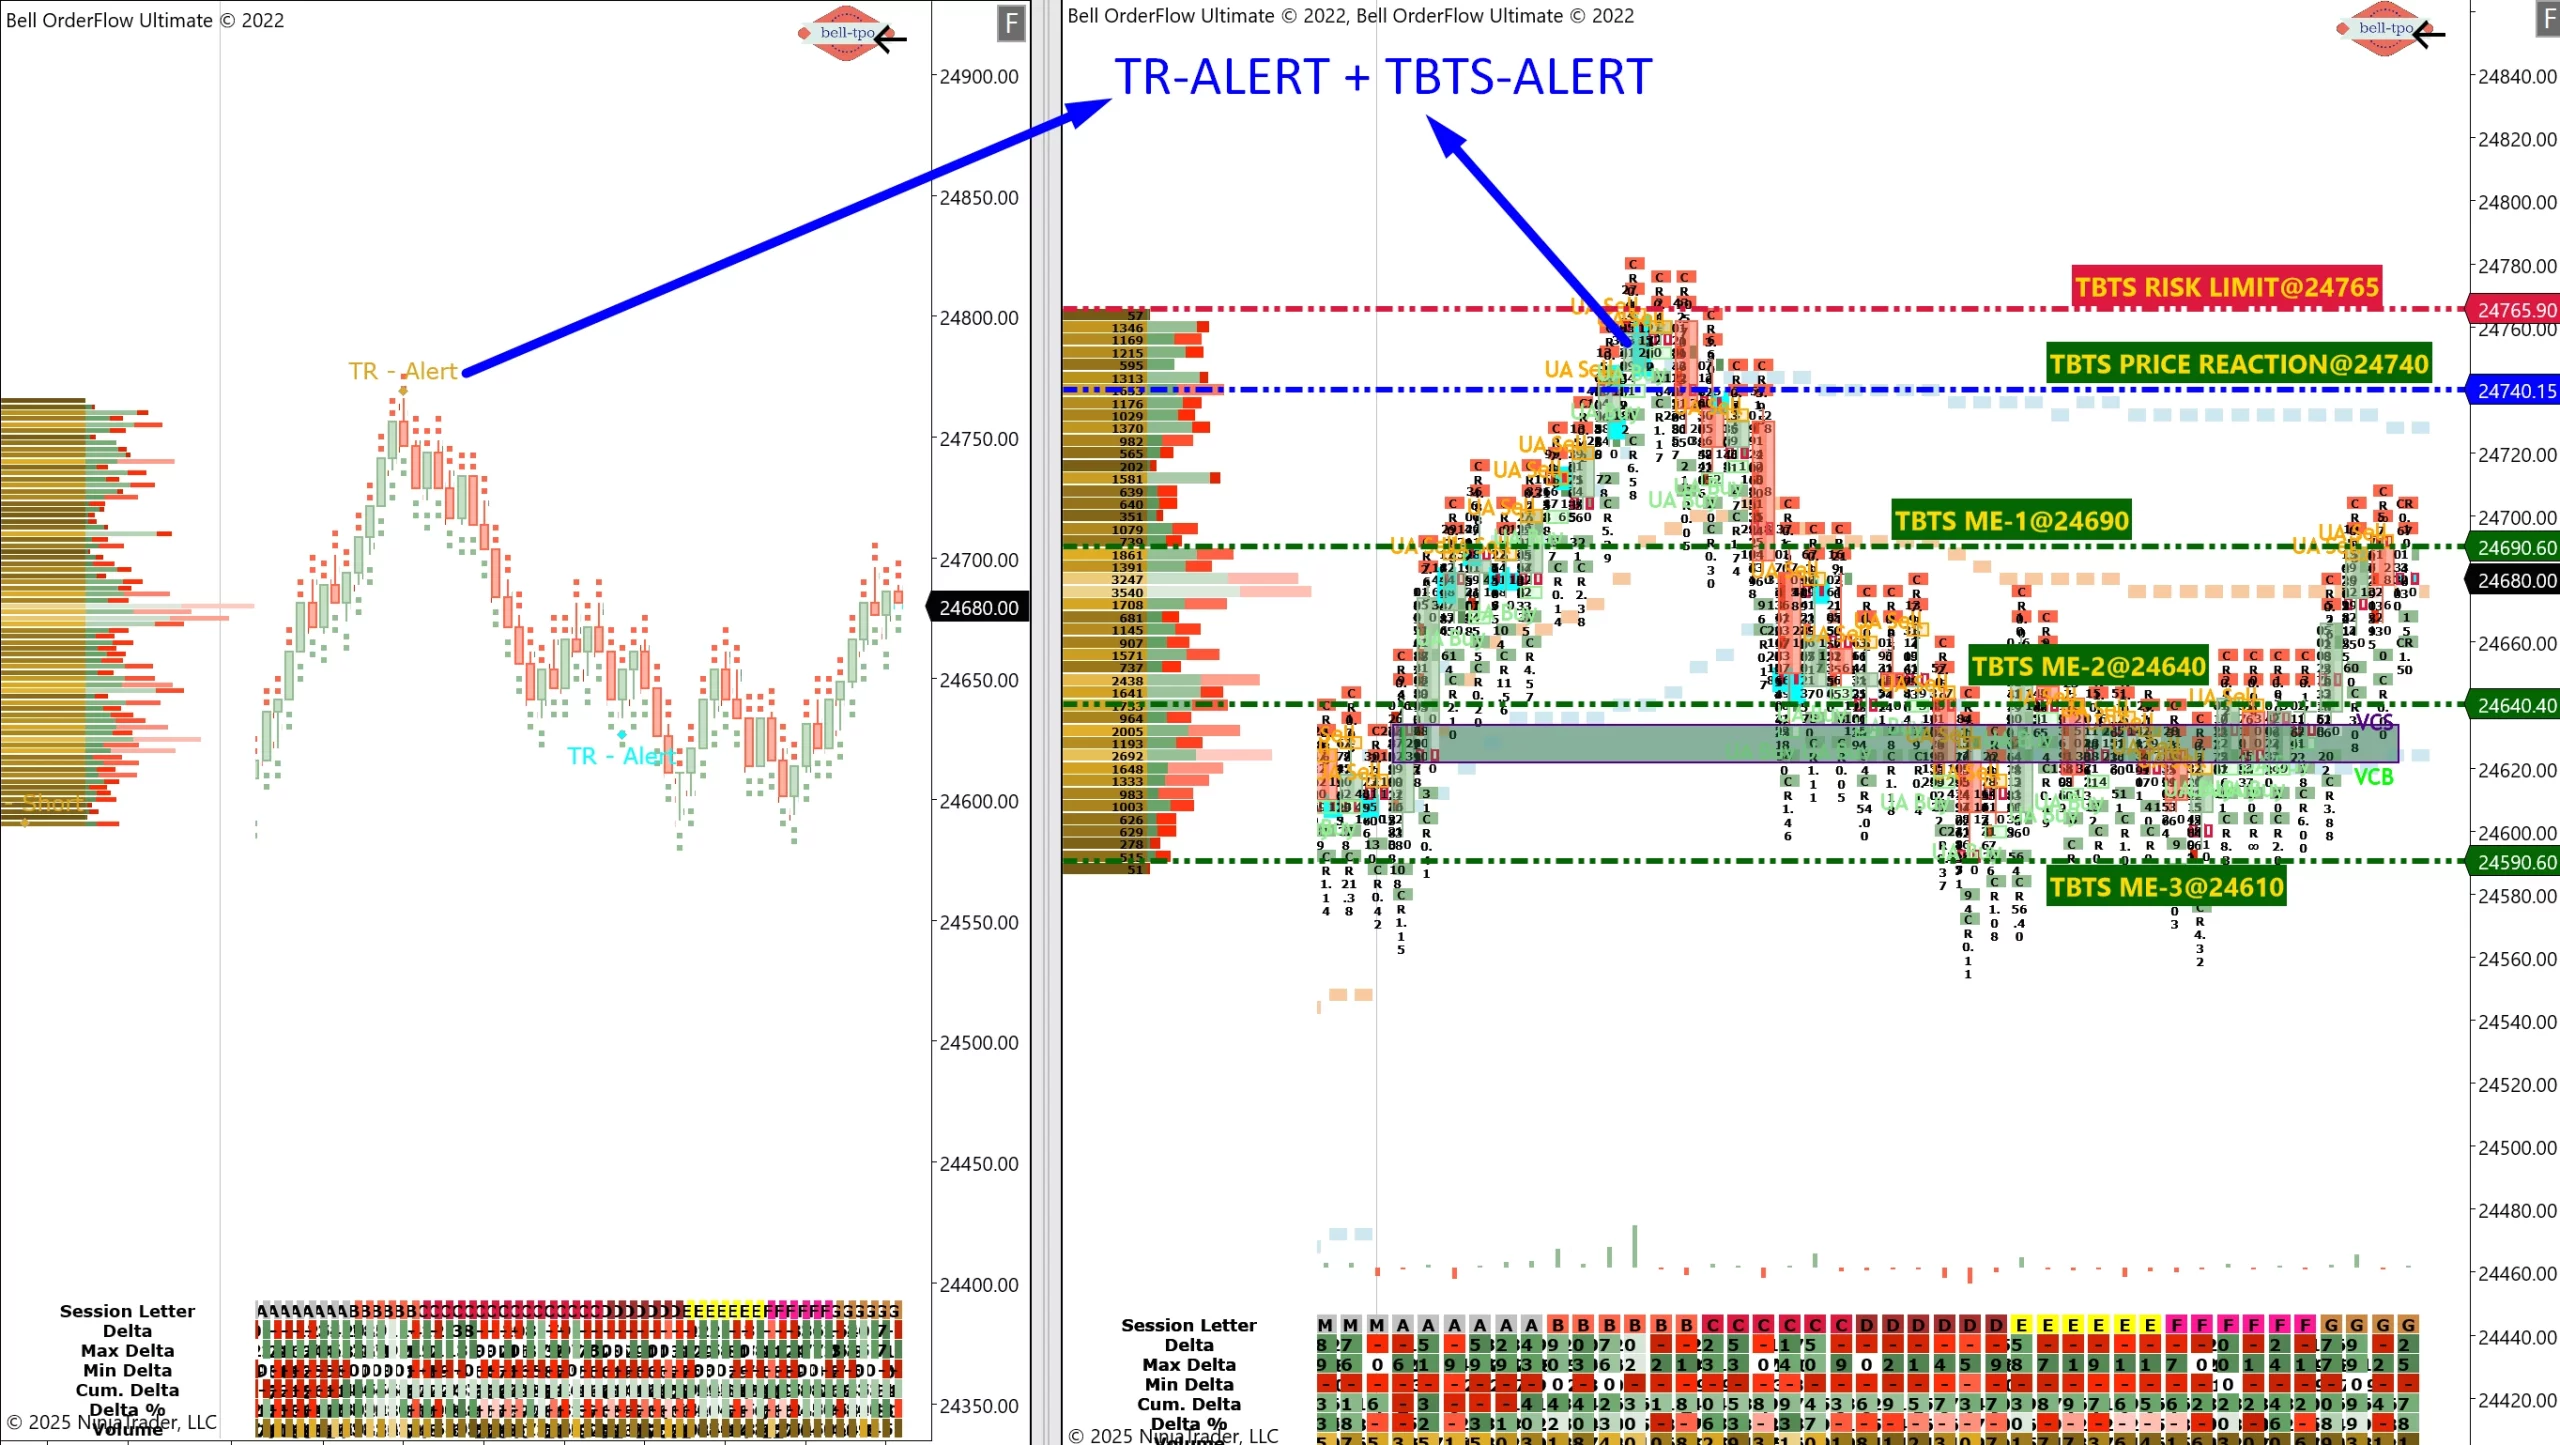
TBTS Risk Limit – 24765
- The Risk Limit serves as a predefined reference to measure adverse price movement from the alert candle.
- Maintaining awareness of this level helps in controlling exposure when price behaves unexpectedly.
TBTS Price Reaction – 24740
- This is the first key level where market participants responded to the TBTS alert.
- The reaction zone gives insight into whether momentum is likely to continue or pause.
Move Extension Levels
ME-1 – 24690- The first measured milestone after the Price Reaction, indicating early continuation of directional intent.
- Often serves as the first checkpoint for short-term momentum.
- Represents sustained follow-through beyond ME-1, suggesting stronger conviction in the move.
- This level often confirms that initial momentum is building into a trend.
- Marks deeper market extension and the completion of the planned TBTS move for the day.
- Reaching ME-3 indicates that sellers maintained control until the final phase of the move.
TR-Alert Confirmation
- The TR-Alert identified a shift in market control, further validating the TBTS directional bias.
- This additional confirmation helped in holding positions confidently through the extended move.
Conclusion
The combination of TBTS alerts and TR-Alert confirmation in Bell Orderflow Ultimate provided a clear, structured opportunity to capture a 150-point move in NIFTY_I. Understanding and applying these Orderflow concepts helps traders identify high-probability setups while maintaining a disciplined approach.
Maximize Your Trading Edge with Bell Orderflow UltimateVisit www.belltpo.com or reach out to us for more details.
🚨 Disclaimer: We are a software and indicator development company. This chart and analysis are for educational and informational purposes only. This is not investment advice or a recommendation to buy, sell, or trade any financial instrument. Users must conduct their own research before making any trading decisions. Past performance is not indicative of future results.