150-Point Up Move Captured with Bell Orderflow Ultimate – VC Zone + MR & TBS Alerts in Focus!
Today’s session on NIFTY_I delivered a clean 150-point upside move, captured in two phases using the structural strength of Bell Orderflow Ultimate.
🔹 The first leg was driven by a VC-Zone price reaction,
🔹 The second leg was confirmed by MR-Alert and TBS Alert, validating a sustained uptrend.
No down moves were taken — both phases showcased bullish strength based on real-time alerts and price structure.
🔍 Price Action Breakdown
VC-Zone Phase – ~50 Points
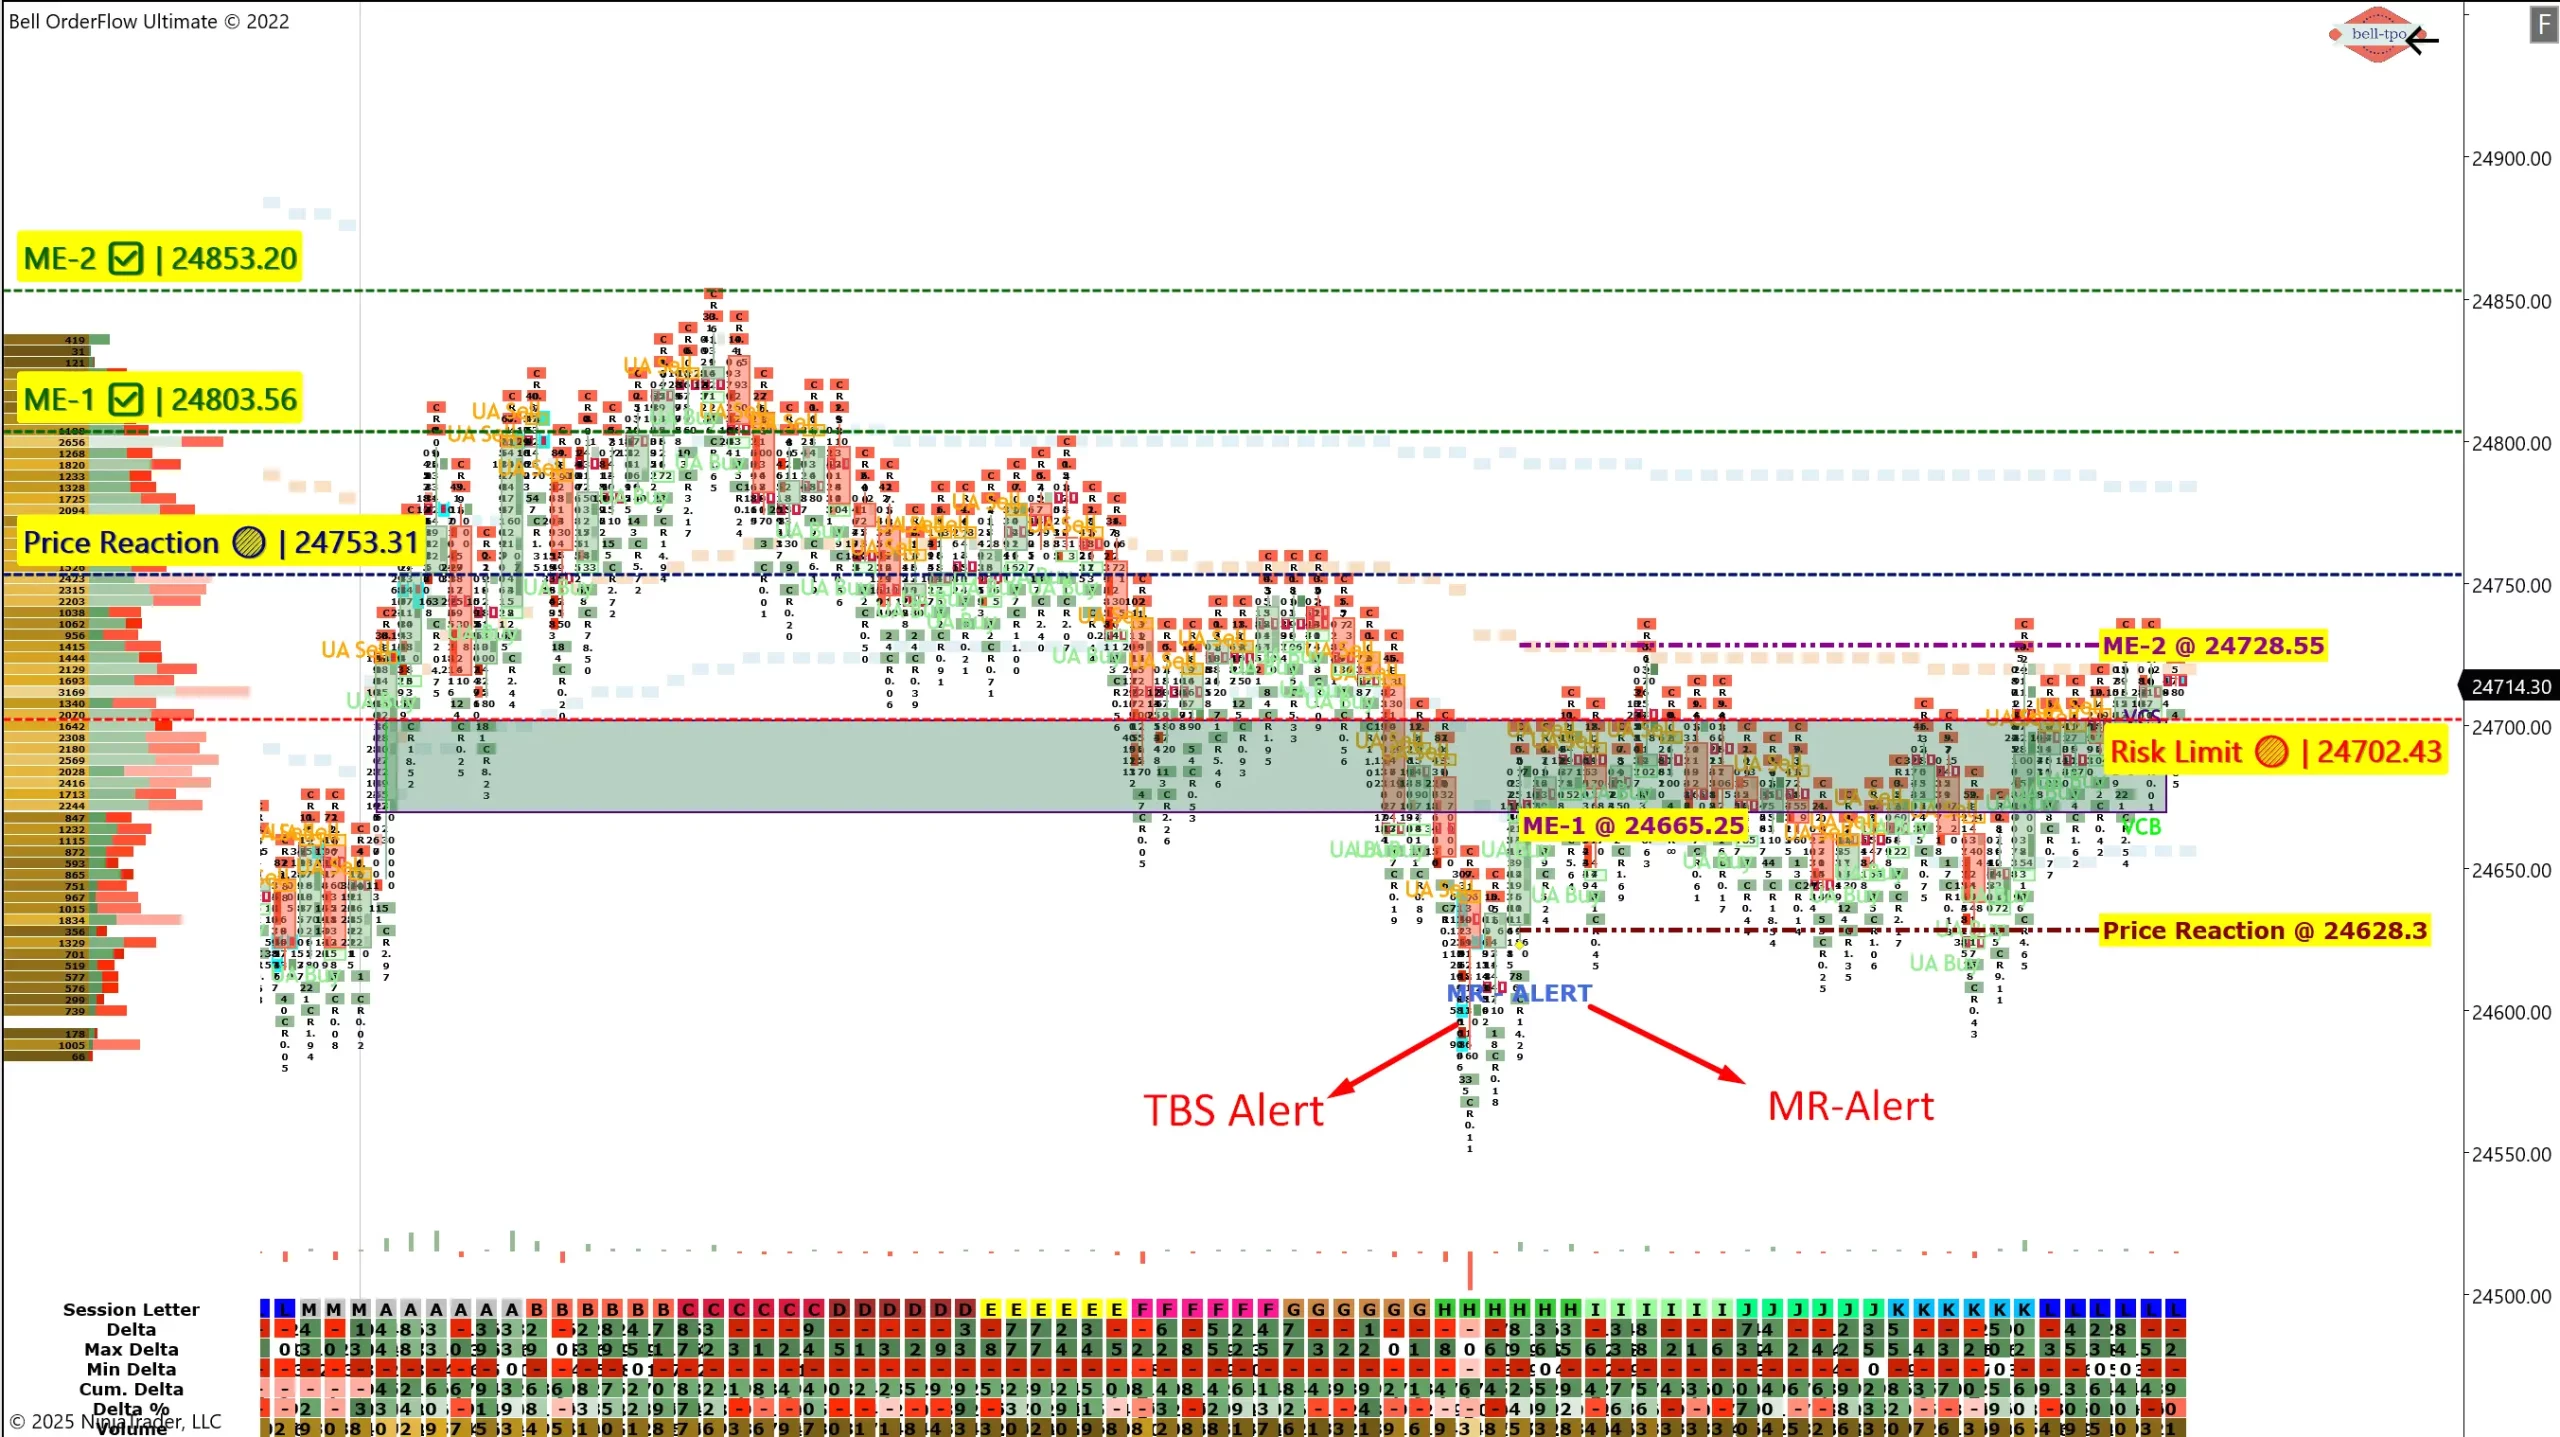
- 📍 Price Reaction @ 24753.31
- Price moved up through ME-1 @ 24803.56, showing clear intent.
- 🟥 Faced resistance near Risk Limit @ 24702.43 before consolidation.
- Price did not reach ME-2 in this leg, but momentum was intact.
MR-Alert + TBS Alert Phase – ~100 Points
- 📍 Price Reaction @ 24628.30
- ⚠️ MR-Alert and 🔁 TBS Alert triggered near this zone, indicating bullish continuation.
- Price held above ME-1 @ 24665.25
- 🟢 Continued through ME-2 @ 24728.55, affirming directional strength.
This phase marked the larger portion of the day’s move with well-aligned confirmation from both structure and signals.
🧭 Key Market Structure Observed
| Description | Level |
|---|---|
| Price Reaction (VC Zone) | 24753.31 |
| ME-1 (Upside) | 24803.56 |
| Risk Limit (Resistance) | 24702.43 |
| Price Reaction (TBS/MR) | 24628.30 |
| ME-1 (Lower Zone) | 24665.25 |
| ME-2 (Upper Zone) | 24728.55 |
📊 Session Summary:
| Phase | Signal Type | Approx. Points |
|---|---|---|
| Phase 1 | VC-Zone Based Movement | ~50 Points |
| Phase 2 | MR + TBS Supported Flow | ~100 Points |
| Total Upside Move | — | ~150 Points |
📌 Why It Worked:
Bell Orderflow Ultimate combines price structure, volume behavior, and live alert signals like VC Zones, MR, and TBS to offer a high-probability trading environment — without prediction, purely based on market logic.
💡 Maximize Your Trading Edge with Bell Orderflow Ultimate
📊 Let structure guide your decision-making — with real-time VC Zones, MR/TBS Alerts, and Market Equilibrium logic.
👉 Visit www.belltpo.com or connect with us to learn more.
🚨 Disclaimer:
We are a software and indicator development company. This chart and analysis are for educational and informational purposes only. This is not investment advice or a recommendation to buy, sell, or trade any financial instrument. Users must conduct their own research before making any trading decisions. Past performance is not indicative of future results.