Educational Takeaway: Net 190 Points Move Captured in NIFTY_I with VC + TR + TBTS + UA + CR using Bell Orderflow Ultimate
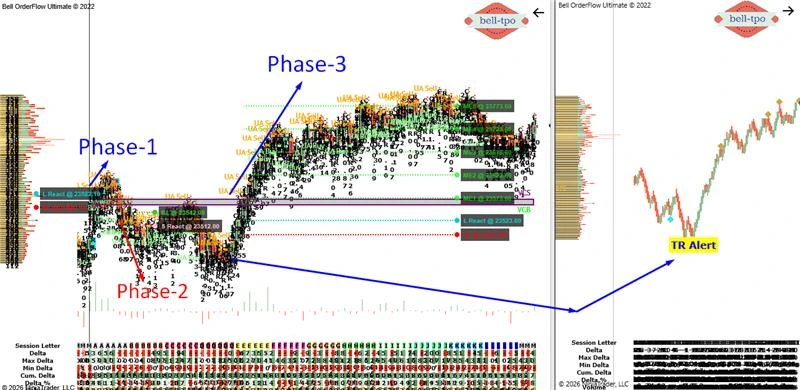
The session in NIFTY_I demonstrated how multiple Bell Orderflow Ultimate components worked together to map risk, reactions, equilibrium zones, and directional continuation in a structured manner. Using VC, TR, TBTS, UA, and CR combinations, the market delivered a highly educational sequence across multiple phases while respecting key Orderflow reference levels.
Maximize Your Trading Edge with Bell Orderflow Ultimate Visit www.belltpo.com or reach out to us for more details.
Phase 1 – 30 Points Risk Limit Hit
L React (Long Price Reaction @ 23582.10)
- The L React zone highlighted the first important price reaction area where responsive participation emerged.
- This level acted as an early intraday reference point, helping traders observe how price behaved around reaction-based liquidity.
RL (Risk Limit @ 23552.10)
- The RL zone defined the maximum acceptable adverse movement for the setup structure during this phase.
- Once price reached the Risk Limit area, it confirmed how effectively Bell Orderflow Ultimate identifies invalidation boundaries with precision.
Phase 2 – 30 Points Risk Limit Hit
RL (Risk Limit @ 23542.00)
- The second RL zone again established a clearly defined protection boundary for the developing structure.
- Price respecting this area showcased the importance of disciplined risk mapping during volatile market conditions.
S React (Short Price Reaction @ 23512.00)
- The S React level marked a fresh reaction zone where price behavior became highly responsive.
- This reference acted as an important Orderflow observation area for tracking participation and momentum shifts.
Phase 3 – 250 Points Long Move (TR + CR)
This phase demonstrated the real strength of combining TR and CR with Bell Orderflow Ultimate. After establishing a stable reaction structure, the market expanded through multiple equilibrium zones with excellent directional continuation.RL (Risk Limit @ 23493.60)
- The RL level served as the structural protection reference before the expansion phase started.
- Maintaining acceptance above this zone helped sustain confidence in the broader directional move.
L React (Long Price Reaction @ 23523.60)
- The L React zone became the activation area from where strong continuation behavior emerged.
- Price response around this level indicated sustained participation and acceptance from responsive participants in the auction process.
Market Equilibrium (ME) Progression
ME-1 (Market Equilibrium @ 23573.60)
- ME-1 acted as the first balance checkpoint after the initial expansion began.
- Price acceptance above this equilibrium suggested healthy continuation in the ongoing structure.
ME-2 (Market Equilibrium @ 23623.60)
- ME-2 provided the next important equilibrium transition during the upward auction process.
- The market maintained strong directional acceptance while respecting this zone efficiently.
ME-3 (Market Equilibrium @ 23673.60)
- ME-3 highlighted continued strength in the developing auction structure.
- Price behavior around this equilibrium reflected stable momentum without major structural weakness.
ME-4 (Market Equilibrium @ 23723.60)
- ME-4 acted as an advanced equilibrium reference during the later stage of expansion.
- Sustained acceptance near this level reinforced the continuation characteristics of the move.
ME-5 (Market Equilibrium @ 23773.60)
- ME-5 represented the final major equilibrium projection achieved during the session.
- The market reaching this zone demonstrated how equilibrium mapping can help visualize structured price progression.
Conclusion
This NIFTY_I session was an excellent educational example of how Bell Orderflow Ultimate combines VC, TR, TBTS, UA, and CR concepts to identify structured market behavior. From reaction zones and Risk Limits to equilibrium progression, the session highlighted the importance of disciplined Orderflow-based analysis in understanding auction dynamics.Maximize Your Trading Edge with Bell Orderflow Ultimate Visit www.belltpo.com or reach out to us for more details.