Educational Takeaway: Net 120 Points Move Captured in NIFTY_I with VC + TR + MR + TBTS + CR using Bell Orderflow Ultimate
The session in NIFTY_I showcased how structured orderflow references combined with equilibrium analysis can help identify momentum continuation, exhaustion, and directional shifts with precision. Using VC, MR, TBTS, and CR combinations, Bell Orderflow Ultimate highlighted multiple high-probability reaction zones throughout the trading session.
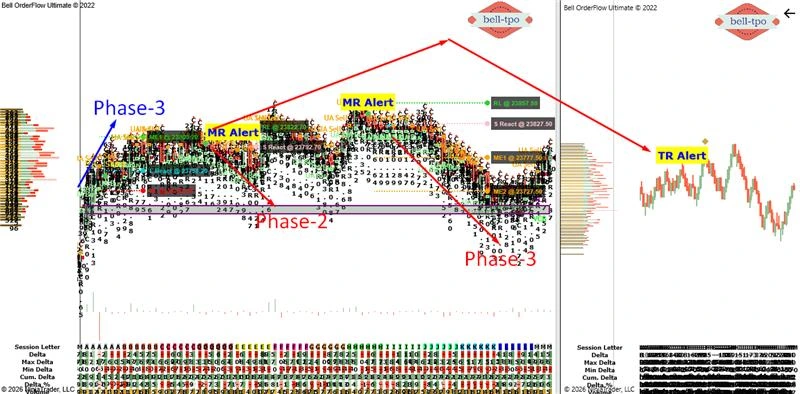
The market moved through three distinct phases, demonstrating how equilibrium levels, reaction zones, and risk boundaries work together to provide a disciplined framework for understanding market behavior.
Maximize Your Trading Edge with Bell Orderflow Ultimate Visit www.belltpo.com or reach out to us for more details.
Phase 1 – 50 Points Long Move (VC + TBTS + CR)
ME-1 (Market Equilibrium @ 23808.20)
- The ME-1 level acted as the primary balance zone where price acceptance created a strong directional foundation. Sustained activity above the equilibrium region indicated increasing market confidence and momentum continuation.
- Market Equilibrium levels help identify areas where opposing participants initially agree on value before imbalance expands. Once price gains acceptance away from equilibrium, directional momentum often accelerates efficiently.
L React (Long Price Reaction @ 23758.20)
- The Long Price Reaction level showed responsive participation as price revisited the reaction zone during the session. Strong absorption near the level helped maintain upside structure and continuation strength.
- Price Reaction zones represent areas where aggressive market participants actively defend directional movement. These zones often become important references for identifying momentum stability and intraday confidence.
RL (Risk Limit @ 23728.20)
- The Risk Limit level defined the structural boundary for the ongoing upward market context. Price respecting this zone helped maintain the integrity of the directional move during Phase 1.
- Risk Limit levels are essential for understanding when market structure remains valid or begins weakening. They provide objective invalidation references that help traders avoid emotional interpretation.
Phase 2 – 30 Points Risk Limit Hit (TR + MR + CR)
RL (Risk Limit @ 23822.70)
- During the second phase, the market failed to sustain above the active structure and eventually reached the Risk Limit zone. This confirmed exhaustion in continuation strength and increasing uncertainty in directional control.
- Risk Limit breaches often indicate that the earlier auction process is losing acceptance. Such behavior helps traders recognize transitions from continuation environments into potential reversal or balancing phases.
S React (Short Price Reaction @ 23792.70)
- The Short Price Reaction zone became active as responsive participants engaged aggressively around the reaction level. Rejection from the zone created downside pressure and weakened the earlier directional structure.
- Short Price Reaction levels help identify areas where supply begins overpowering demand. These zones often provide valuable insight into changing market sentiment and responsive participation.
Phase 3 – 150 Points Short Move (MR + CR)
RL (Risk Limit @ 23857.50)
- The Risk Limit zone acted as a critical structural reference before the major downside expansion began. Failure to reclaim the level reinforced weakness and confirmed continued directional pressure.
- Risk Limit zones become highly important during trend expansion phases because they help validate whether the market remains directional or shifts back into balance. Respecting these levels often strengthens conviction in the ongoing move.
S React (Short Price Reaction @ 23827.50)
- The Short Price Reaction level triggered strong responsive activity as the market faced aggressive rejection near the zone. Continuous rejection around this area helped accelerate downside momentum during the session.
- Price Reaction zones are useful for understanding where institutional participation becomes visible in the market. Strong reactions near these areas often create high-confidence directional continuation environments.
ME-1 (Market Equilibrium @ 23777.50)
- ME-1 acted as the first equilibrium transition zone during the downside move, where temporary balance formed before further imbalance expanded lower. Price acceptance below the equilibrium region confirmed sustained directional control.
- Equilibrium levels during trend continuation often serve as important checkpoints for auction continuation. Failure to reclaim equilibrium generally strengthens directional conviction.
ME-2 (Market Equilibrium @ 23727.50)
- ME-2 developed as a secondary equilibrium reference during the extended downside move. Continued acceptance below this level highlighted persistent weakness and strong market participation from responsive participants.
- Multiple equilibrium shifts during a session indicate evolving market value and auction progression. Tracking these transitions helps traders understand whether momentum remains healthy or begins weakening.
Key Learning from the Session
This NIFTY_I session demonstrated how combining Market Equilibrium levels, Price Reaction zones, and Risk Limit structures can help decode intraday market behavior with clarity. Bell Orderflow Ultimate effectively identified momentum continuation, exhaustion, and structural shifts across multiple phases of the session. Understanding how price behaves around ME, Reaction, and RL levels enables traders to interpret auction strength, market confidence, and imbalance expansion objectively while maintaining disciplined decision-making.Maximize Your Trading Edge with Bell Orderflow Ultimate Visit www.belltpo.com or reach out to us for more details.